
阅读量:2
C10M问题涉及到经典的C10K Internet可扩展性问题,它最初发生在Web服务器的背景下。C10K问题包括在一台机器上成功支持10,000个并发连接。虽然C10K问题目前由特定的Web服务器解决,但C10M问题,即在一台机器上支持1000万个并发连接,仍然是一个具有挑战性的问题,不仅对Web服务器,而且对一般任何互联网服务器都是如此。
MigratoryData服务器是一个实时Web服务器,它使用WebSocket协议和HTTP协议与客户端通信。与传统的Web服务器不同,MigratoryData Server不使用请求-响应交互模型(采用短连接)。相反,它沿着持久连接使用发布/订阅模型。当客户端永久连接时,MigratoryData Server使数据能够及时、低延迟地交付给它的客户端。
除了作为实时Web服务器的角色,MigratoryData server还实现了传统上由企业消息系统提供的功能,如发布/订阅交互、主动/主动集群、保证消息传递、授权以及最流行环境的API库。
虽然对于一般的Web服务器来说,实现高可伸缩性是一项困难的任务,但是在不牺牲企业消息传递特性的情况下,实现实时Web服务器的高可伸缩性则更加困难。
在本文中,我们演示了MigratoryData服务器能够在单个商品机器上处理1000万个并发连接。此外,它能够向这1000万用户推送几乎1gbps的实时数据(每个用户每分钟接收512字节的消息),平均延迟低于100毫秒。
MigratoryData的发布/订阅交互
订阅客户端使用持久的WebSocket或HTTP连接连接到MigratoryData服务器,并使用MigratoryData的协议订阅一个或多个主题(也称为主题)。发布客户端与订阅客户端以相同的方式与MigratoryData服务器通信,但它们发布消息。消息主要包含一个主题和一些数据。当MigratoryData服务器接收到一条消息时,它将该消息分发给订阅该消息主题的所有客户端。
指标设置
我们使用多个发布客户端将消息推送到MigratoryData服务器,该服务器通过HTTP持久连接将消息推送到多个订阅客户端。
基准测试中使用的发布工具MigratoryData Benchpub能够以可配置的频率发布可配置大小的消息。订阅工具MigratoryData Benchsub能够打开可配置数量的并发连接,订阅可配置数量的主题,并计算为已订阅主题接收到的消息的延迟。Benchpub和Benchsub都使用MigratoryData的协议,因此它们模拟真实的应用程序。
下图显示了基准测试的架构。
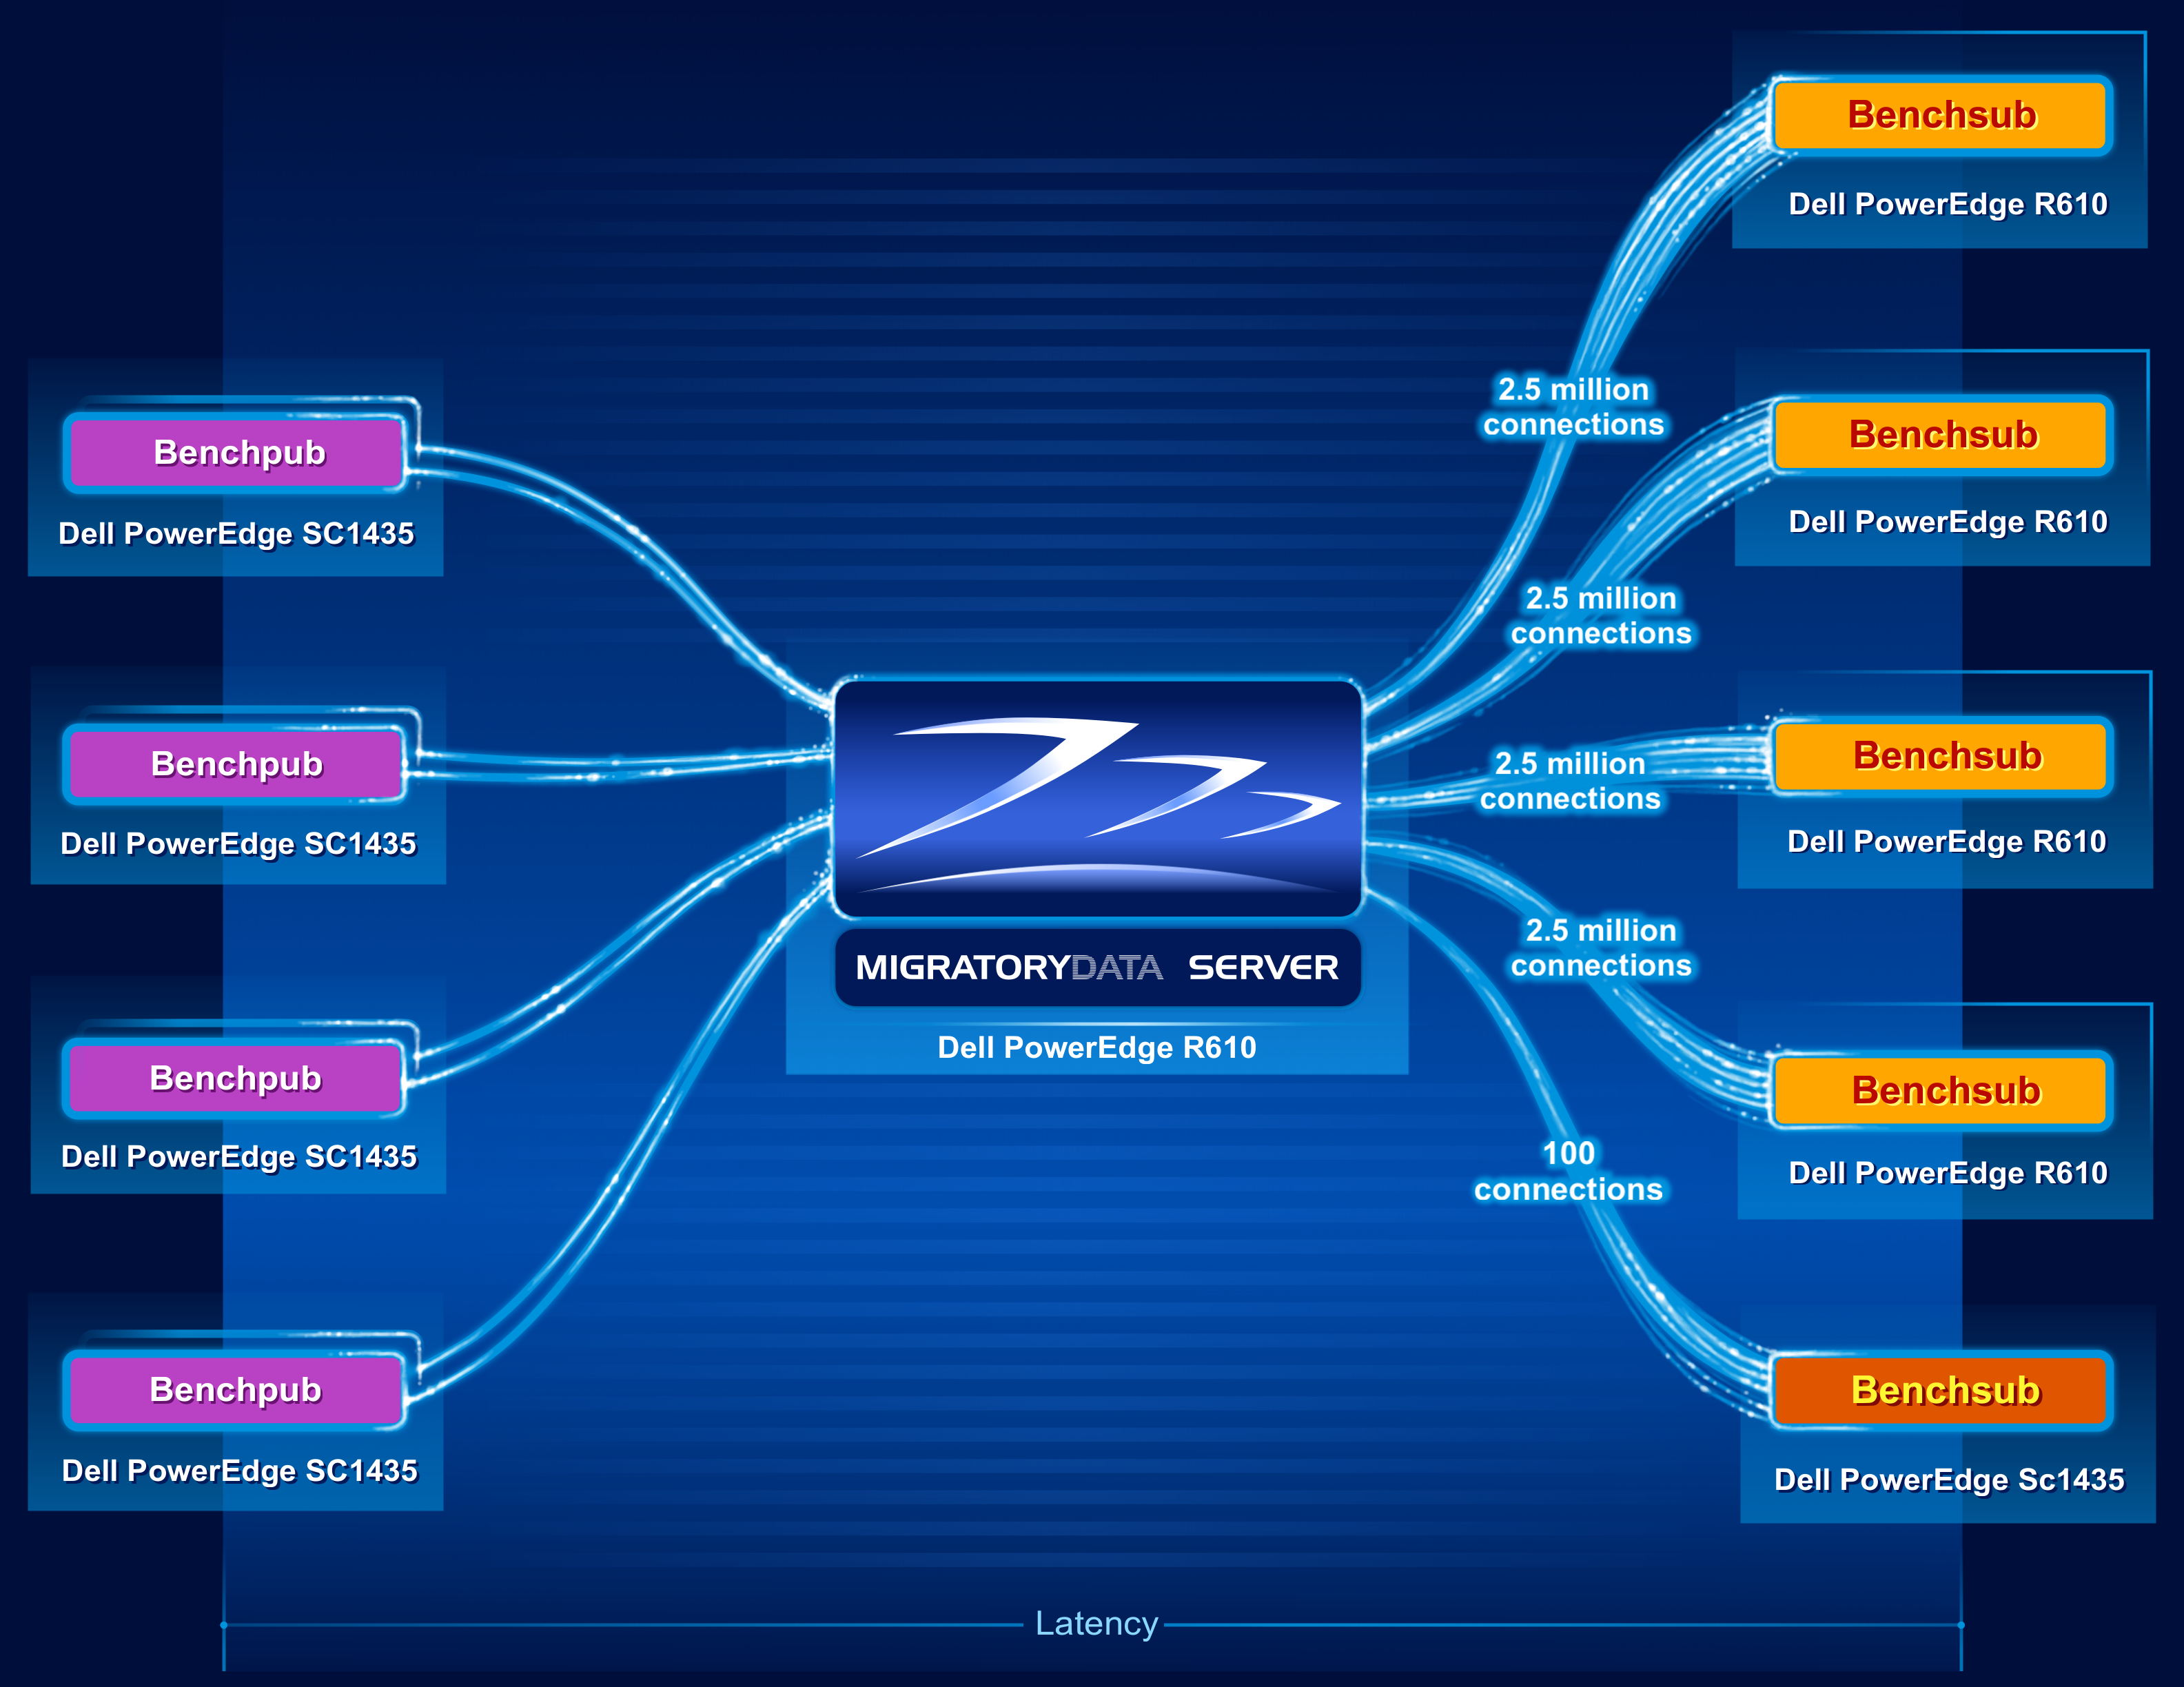
基准测试使用了9台机器,如下:
- One Dell R610 machine was utilized to run one instance of the MigratoryData server. The specifications of this 1U machine are as follows:
- 2 x Intel Xeon X5650 CPU at 2.66 GHz (6 cores per CPU, totaling 12 cores)
- 96 GB RAM (DDR3 at 1333 MHz)
- Network adapter Intel X520-DA2 (10 Gbps)
- CentOS / RHEL 7.1 with the default kernel 3.10.0-229 (without kernel recompilation)
- Four Dell R610 machines were utilized to run four instances of Benchsub. Each Benchsub instance simulated 2.5 million concurrent users each, totaling 10 million concurrent users. Each user subscribed to a distinct subject. Therefore, the total number of concurrent subjects was also 10 million.
- Four Dell SC1435 machines were utilized to run eight instances of Benchpub (four pairs of instances). Each of the eight Benchpub instances published at a frequency of 21,000 messages per second, with each message containing a sequence of 512 random bytes. The total message throughput was therefore 168,000 messages/second (i.e. 10,080,000 messages/minute). In this way, each user received one message per minute.
- Finally, an additional Benchsub instance was used to simulate 100 concurrent users, representing samples of the population of 10 million concurrent users. This Benchsub instance was used to compute supplemental latency statistics – in addition to the latency statistics computed by the other four Benchsub instances. These other four Benchsub instances used the latencies of all messages received by all 10 million users to compute their statistics, instead of sampling the data.
如上图所示,延迟是从Benchpub创建消息到Bechsub从MigratoryData服务器接收到消息的时间定义的。
结果
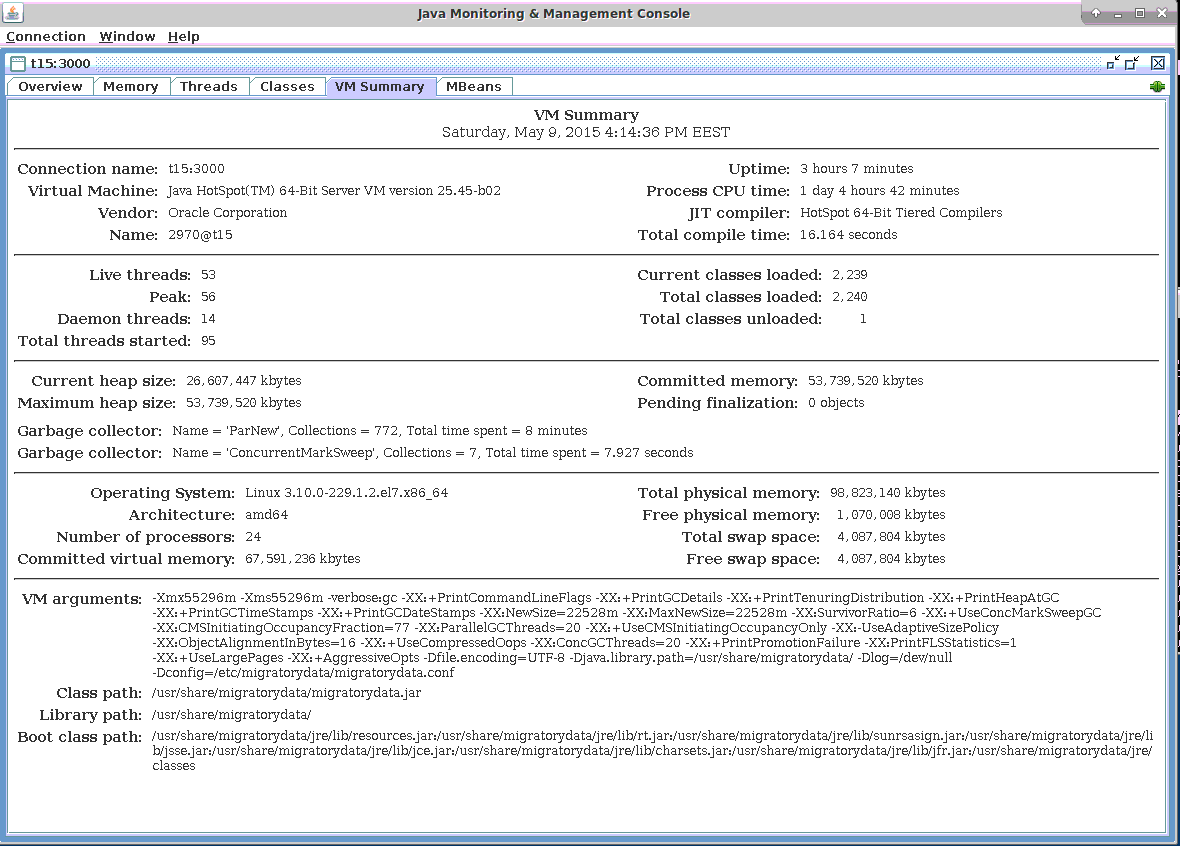
MigratoryData Server通过JMX和其他协议提供高级监控。我们使用jconsole工具(包含在Java开发包中)通过JMX监控MigratoryData服务器。在下面的结果中,我们展示了JMX监控期间获得的屏幕截图。
连接
正如上面的基准设置部分所描述的那样,在4个基准测试中打开了1000万个并发连接,模拟了250万并发用户。每1000万用户都订阅了一个不同的主题,因此也有1000万的并发订阅主题。此外,第5个基准测试实例打开了另外100个并发连接。
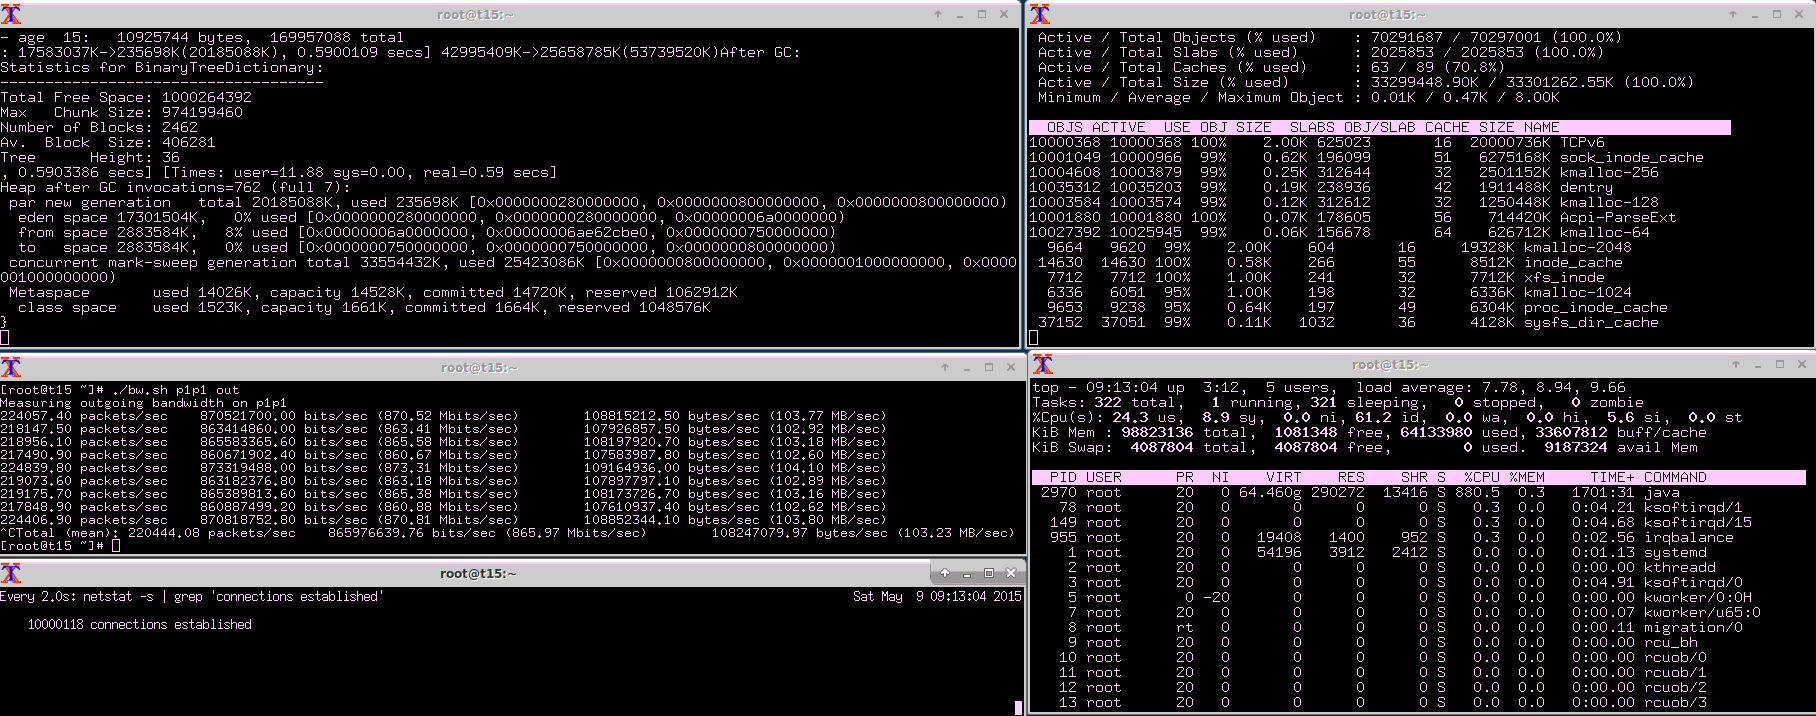
从下面的JMX截图可以看出,MigratoryData Server处理了10,000,108个并发连接(参见JMX指标ConnectedSessions)。相同数目的并发套接字连接由netstat和slabtop工具确认(参见下面网络利用率小节中的屏幕截图)。
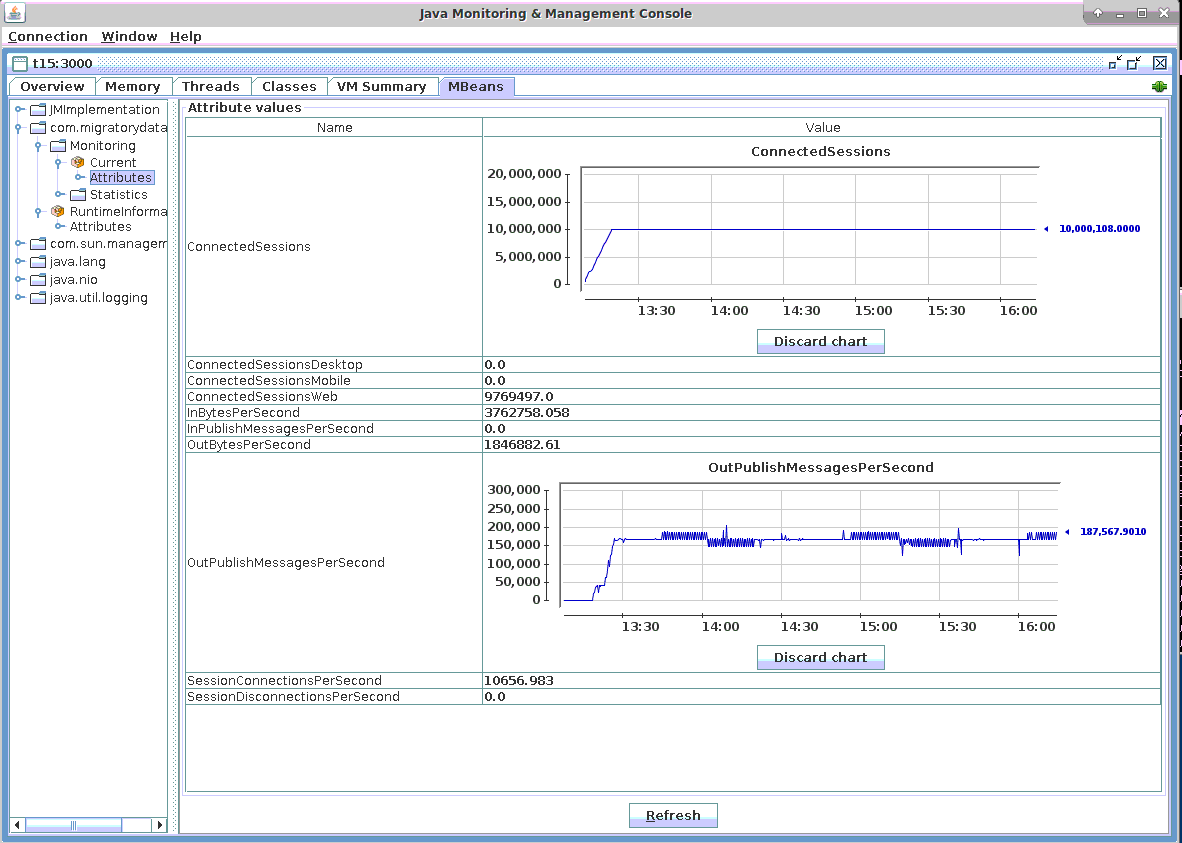
消息
如基准测试设置部分所述,8个Benchpub实例在4台机器上运行,并将消息发送到MigratoryData服务器。
为了让1000万用户中的每一个每分钟接收一条消息,8个Benchpub实例中的每一个每秒发布21000条消息。每条消息的有效载荷由一个512字节的随机序列组成。因此,8个Benchpub实例以每秒168,000条消息(即10080,000条消息/分钟)的速度发送到MigratoryData服务器,然后以相同的消息频率将其推送到订阅客户端。
上面连接小节的屏幕截图显示,传出消息的吞吐量大约是每秒168,000条消息(即10080,000条消息/分钟)(参见JMX指示器OutPublishMessagesPerSecond)。
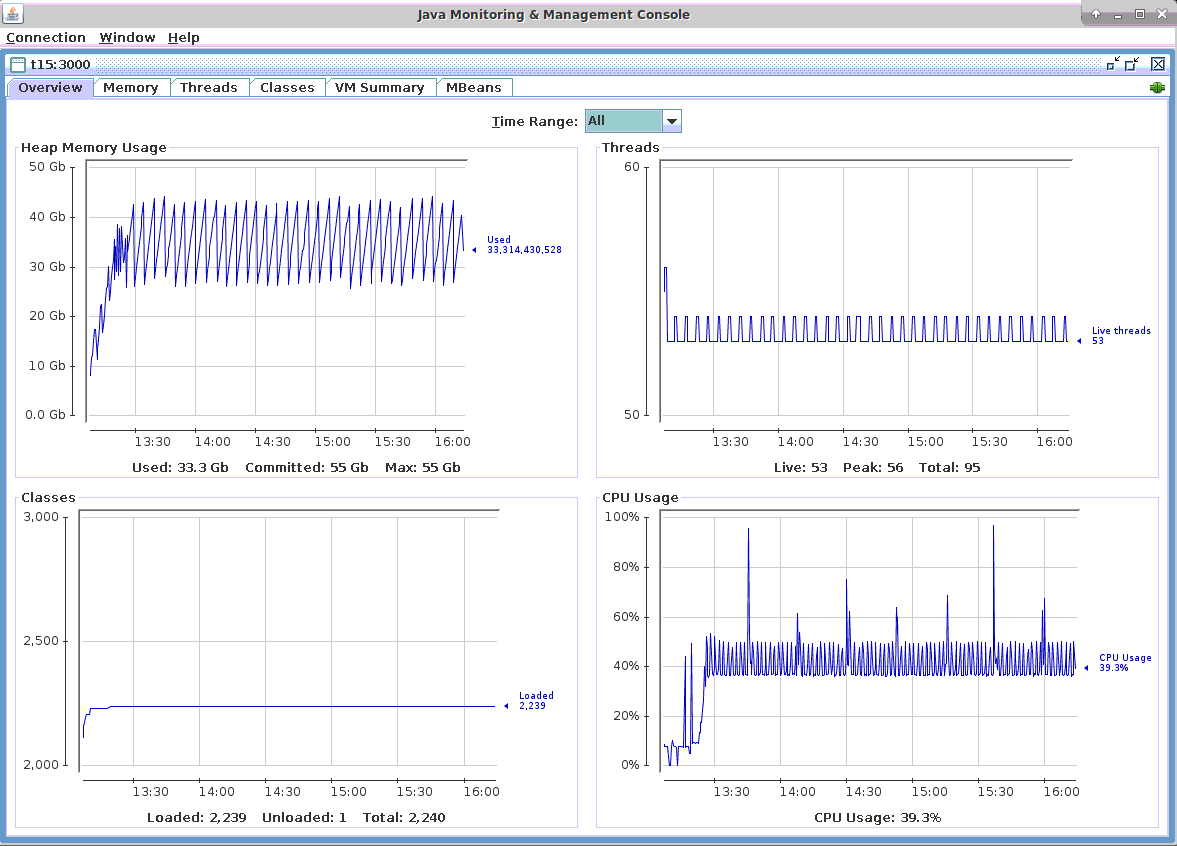
CPU利用率
在下面的截图中,可以看到承载MigratoryData服务器的机器的CPU使用率低于50%,当主要的JVM垃圾收集发生时,会时不时出现峰值。事实上,根据我们的观察,MigratoryData服务器严格使用的CPU百分比低于40%。在屏幕截图中可以看到,当发生轻微JVM垃圾收集时,差异从40%以下到大约50%。
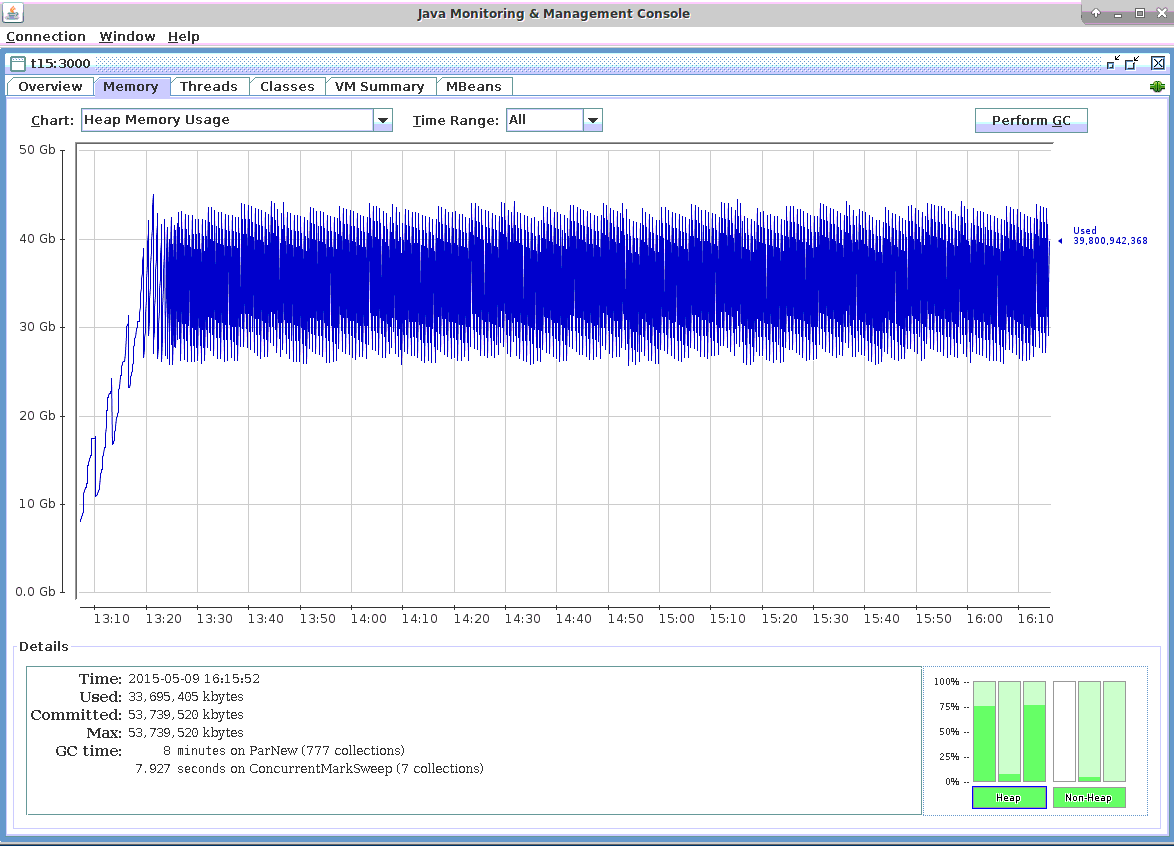
内存利用率
在下面的截图中,你可以看到内存使用是可预测的,并且在测试运行3小时后模式没有改变。更重要的是,在3个小时的测试运行中,既有小的JVM垃圾回收,也有大的JVM垃圾回收。因此,该测试模拟了可能发生两种垃圾收集的真实情况。
网络利用率
正如你在下面的截图中看到的,向1000万个并发客户端推送16.8万条消息/秒(即1008万条消息/分钟)的流量是每秒103兆字节,即0.8 Gbps。
每条消息的负载为512字节,吞吐量为16.8万条消息/秒(即1008万条消息/分钟),总吞吐量为82兆字节/秒。MigratoryData协议和TCP/IP协议增加的开销导致了21 MB/秒的差异,实际带宽利用率为103 MB/秒,这导致每个消息多了131字节。
事实上,MigratoryData协议和TCP/IP协议引入的开销甚至不到每个消息131字节。在计算带宽时(使用内核向/proc/net/dev报告的准确流量),我们包括了网络接口的所有输出流量。这种流量几乎完全是由推送到客户端的消息产生的。然而,它还包括一些由多个ssh会话产生的额外流量、JMX监控控制台以及发送给发布者以接收消息的确认。
延迟
正如在基准测试设置部分中定义的那样,延迟是消息通过MigratoryData服务器从发布者传播到订阅者所需的时间。当Benchpub创建消息时,它将创建时间作为消息的一部分。通过这种方式,Benchsub可以将消息的创建时间和接收时间之差作为延迟时间来计算。
除了计算收到的所有消息的延迟,基准测试还计算平均值、标准偏差和最大值。对于收到的每一个新消息,都对这些延迟统计数据进行了增量计算。通过这种方式,获取所有收到的消息的统计数据,而不仅仅是样本大小。
在下面的截图中,“消息总数”信息显示,在基准测试运行的3小时内,四个基准子实例中的每个都收到了大约4亿条消息。因此,下面的延迟统计是非常准确的,是根据超过15亿条消息的总数计算的:
- Latency Mean is 61 milliseconds
- Latency Standard Deviation is 140 milliseconds
- Latency Maximum is 1.7 second
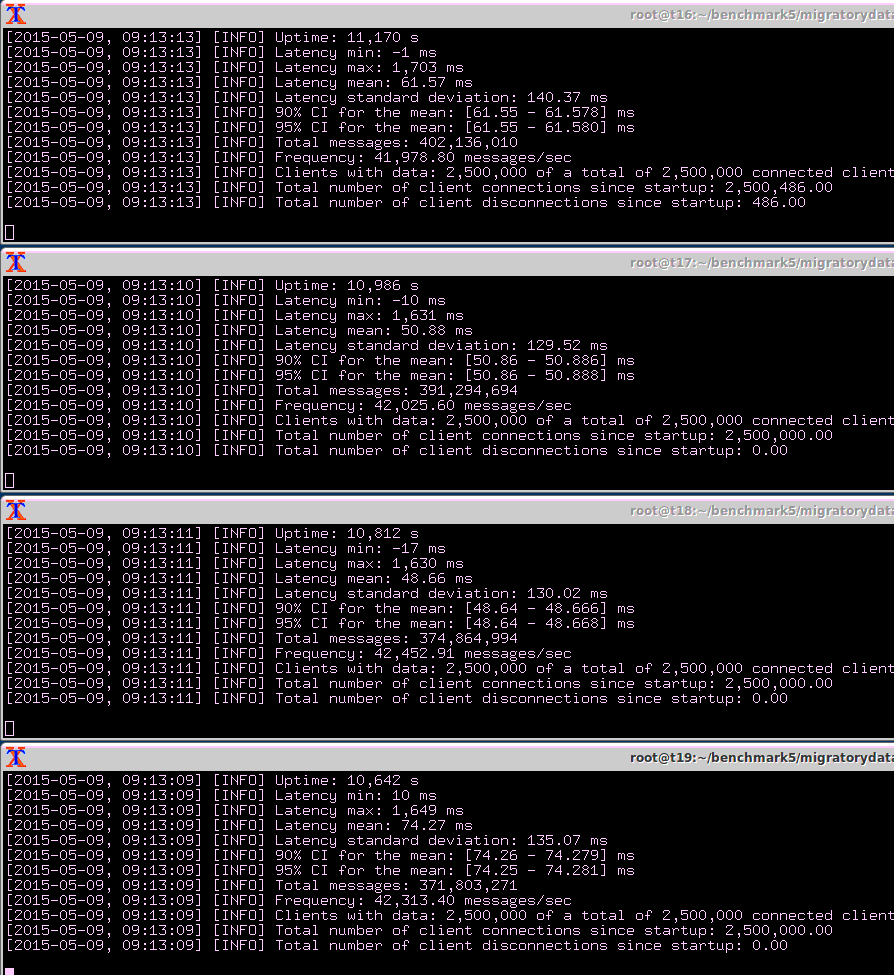
与ntp同步的时间不够长,无法实现完美的时间同步,这就是观测到的最小延迟为负的原因。因为最小延迟通常为0,负的和正的最小延迟表示机器之间不完美的时间同步所带来的差异。
更多的延迟统计信息
在上一节中,我们解释了所有1000万个客户端接收到的所有消息的延迟统计数据——均值、标准差和最大值。然而,对于实时服务来说,其他值得关注的统计信息,包括中位数、第95百分位数和第99百分位数,不能增量计算。为了计算这些额外的统计信息,我们需要所有的延迟。在性能测试中记录15亿个延迟是不现实的,因此我们使用抽样来估计这些额外的统计信息。
如基准测试设置部分所述,我们使用第五个基准实例从整个1000万人口中收集100个并发用户的样本。100个用户中的每一个都从1000万个主题中随机选择了一个主题。
在基准测试中,我们记录了100个用户中每个用户166分钟的所有延迟。由于每个用户平均每分钟收到一条消息,我们计算并记录了每个用户大约166个延迟。随后,我们计算了这100个用户的中位数、平均值、第95百分位数和第99百分位数(结果以CSV文件的形式提供,其中还包括每个用户订阅的随机主题,以及每个用户收到的确切消息数)。
最后,我们计算了一个99%的置信区间,我们可以估计,如果我们重复测试,有99%的概率所有用户的平均值如下所示:
- Median Latency: 18.71 ms ± 1.29 ms
- Mean Latency: 58.52 ms ± 2.83 ms
- 95th Percentile Latency: 374.90 ms ± 21.51 ms
- 99th Percentile Latency: 585.06 ms ± 17.16 ms
我们可以看到,前一小节中为所有用户(超过15亿延迟)计算的平均值(61毫秒)属于平均值的置信区间:[55.69 ms, 61.35 ms](即58.52 - 2.83 ms和58.52 + 2.83 ms)。
结果总结
| Number of concurrent client connections | 10,000,100 |
| Number of concurrent subscribed subjects | 10,000,000 |
| Number of messages per client | 1 message per minute |
| Payload of each message | 512 random bytes |
| Total messages throughput | 10,080,000 messages per minute |
| Median latency | 18 milliseconds |
| Average latency | 61 milliseconds |
| Standard deviation for latency | 140 milliseconds |
| 95th percentile latency | 374 milliseconds |
| 99th percentile latency | 585 milliseconds |
| Maximum latency | 1.7 seconds |
| Hardware | One Dell PowerEdge R610 with 2 x Intel Xeon X5650 CPU at 2.66 GHz and 96 GB RAM |
| Operating system | CentOS / RHEL 7.1 with the default kernel 3.10.0-229 (without kernel recompilation) |
| CPU utilization | under 50% |
| Network utilization | 0.8 Gigabit per second |
根据我们的观察,在没有minor和majorJVM垃圾收集的情况下,上述所有延迟统计信息都应该在18毫秒的中位数附近。例如,上面的最大延迟是由主要JVM垃圾回收引入的。然而,由于大规模的垃圾回收很少发生,在现实生活中,如此高的延迟每天只会发生几次。
我们的客户有大规模部署(数百万最终用户),其中配置的Java虚拟机不会发生major的JVM垃圾收集。但是,在这些情况下,MigratoryData server每天都会重新启动。
配置调整
基准测试使用了Linux内核、Java虚拟机和MigratoryData服务器的标准配置,只有少量更改,我将在下面详细介绍。
Linux内核
MigratoryData Server运行在一台开箱即用的CentOS / RHEL 7.1机器上。为了证明MigratoryData Server能够解决数据中心常见的商用硬件和操作系统上的C10M问题,我们没有重新编译内核,而是使用默认的3.10.0-229内核。
我们做的唯一的系统配置如下:
- Increased the number of socket descriptors, in order to allow the system to handle 10 million sockets:
- used the sysctl configuration fs.file-max=12000500
- echo 20000500 > /proc/sys/fs/nr_open
- ulimit -n 20000000
- Increased the maximum number of memory pages for TCP using the sysctl configuration:
- net.ipv4.tcp_mem=10000000 10000000 10000000
- Adjusted the buffers of TCP connections with sysctl for better memory usage, as follows:
- _net.ipv4.tcp_rmem=1024 4096 16384 _
- _net.ipv4.tcp_wmem=1024 4096 16384 _
- _net.core.rmem_max=16384 _
- net.core.wmem_max=16384
Statically balanced the hardware interrupts of the network adapter across the logical CPUs using smp_affinity. The Intel X520-DA2 network adapter has 24 tx/rx queues, each having a hardware interrupt (in the /proc/interrupts there are 24 entries for the p1p1 network interface). Coincidentally, the server also has 24 logical processors corresponding to its two six-core CPUs. We used smp_affinity to statically map each interrupt of the 24 tx/rx queues of the network adapter to each of the 24 logical processors.使用smp_affinity静态均衡跨逻辑cpu的网络适配器硬件中断。Intel X520-DA2网络适配器有24个tx/rx队列,每个队列有一个硬件中断(在/proc/interrupts中,有24项用于p1p1网络接口)。巧合的是,服务器也有24个逻辑处理器,对应于它的两个六核cpu。我们使用smp_affinity静态地将网络适配器的24个tx/rx队列的每个中断映射到24个逻辑处理器中的每一个。
Better use of Translation-Lookaside Buffer (TLB) caches by the processor. These caches contain virtual-to-physical address translations and have a small number of entries with the most-recently used pages. Using huge pages of 2 MB instead of the normal 4 KB pages, a TLB entry can handle much more memory, thus making the CPU caching more efficient. Because we allocated 54 GB to the Java Virtual Machine which ran the MigratoryData server, we reserved 60 GB huge pages (30720 huge pages x 2 MB / huge page) using the sysctl configuration:处理器更好地利用翻译后备缓冲器(Translation-Lookaside Buffer, TLB)高速缓存。这些缓存包含虚拟到物理的地址转换,并有少量项,其中包含最近使用的页。使用2 MB的巨型页而不是普通的4 KB页,TLB项可以处理更多的内存,从而使CPU缓存更高效。因为我们为运行MigratoryData服务器的Java虚拟机分配了54 GB,所以我们使用sysctl配置分配了60 GB的巨型页(30720个巨型页x 2 MB /巨型页):
- vm.nr_hugepages=30720
JVM
我们使用Oracle Java 1.8 update 45。下面是我们使用的主要Java虚拟机(JVM)参数(所有的JVM参数都可以在下面的截图中看到):
Allocated 54 GB for the JVM
Used Concurrent Mark Sweep (CMS) Garbage Collector
Enabled huge pages as discussed in the Linux Kernel subsection above by using:
- +UseLargePages
- Used compressed pointers, extended beyond the usual 32 GB limit, in order to optimize the memory footprint (with about 10 GB) by using:
- -XX:ObjectAlignmentInBytes=16 -XX:+UseCompressedOops
MigratoryData Server
我们使用MigratoryData Server 5.0.14。对于其默认配置,我们做了以下更改:
- Enabled the JMX monitoring through the port 3000 (without authentication, and via an unencrypted connection):
- Monitor = JMX
- MonitorJMX.Authentication = false
- MonitorJMX.Listen = 192.168.3.115:3000
- Configured parallelism. In order to better scale on multiprocessor servers incoming users are separated in workgroups based on their IP address. Workgroups run in parallel, using almost independent threads. Thus, we used the following parameters related to parallelism:
- Worgroups = 10
- IoThreads = 20
- Distributed users across workgroups. Because all 10 million users came from only four IP addresses, originating from the four Benchsub instances, we used a parameter called BenchmarkMode in order to distribute users across workgroups as would happen in real life when they would all come from different IP addresses. To achieve this, we used the configuration:
- BenchmarkMode = true
- Reduced the default initial size of the buffers. When handling a message, a buffer of 8192 bytes is created. If the message is higher than 8192 bytes, the buffer automatically expands in order to hold the entire message. On the other hand, if the messages is smaller than 8192 some memory space remains unused. Because we know the payload of our messages is 512 bytes, we reduced the default initial size of the buffers from 8192 to 768 using the following parameters (note that the name of the parameters is quite misleading; it’s not a hard coded limit but a default initial size):
- BufferLimit.Send = 768
- BufferLimit.Receive = 768
- Reduced memory footprint and allowed better performance by using a native C implementation with JNI for socket handling:
- X.Native.Io = true
结论
在HighScalability.com上引用的一次演讲中,Robert Graham讨论了C10M问题。他解释了为什么内核可能是一个问题,而不是实现高可伸缩性的解决方案,并提出了一些构建可伸缩性系统的原则。
在上面网络利用率小节的屏幕截图中,我们观察到Linux内核使用了大约32 GB来保持打开1000万个并发套接字连接。对于通常的系统,每个套接字连接3.2 KB似乎相当合理。然而,随着互联网设备(移动设备和物联网)的爆炸式增长,我们看到系统越来越频繁地需要数百万并发连接。因此,我们呼应Robert对内核的关注,认为Linux可能提供更好的内存使用来处理套接字连接。
此外,Robert讨论的许多原则可以在我们上面介绍的方法中找到:尽可能在内核之外执行,使用高效的线程模型来跨所有处理器扩展,使用巨大的页来优化CPU高速缓存,以及在所有处理器之间分配中断。
也就是说,在这篇文章中,我们演示了使用普通服务器和现成的Linux发行版来解决C10M问题是可行的。此外,考虑到我们的客户拥有数百万最终用户,他们每天通过运行在Linux上的MigratoryData服务器接收实时数据,现在是轻松构建高度可扩展的实时互联网服务的时候了,现有的材料:Linux操作系统,MigratoryData的实时Web服务器,以及MigratoryData的API与几乎任何互联网技术(Web,移动,桌面,服务器,物联网)的库。
要了解有关MigratoryData Server的更多信息,以及它如何帮助您的业务实现有效的高可扩展性,请访问migratorydata.com。
