
阅读量:4
背景
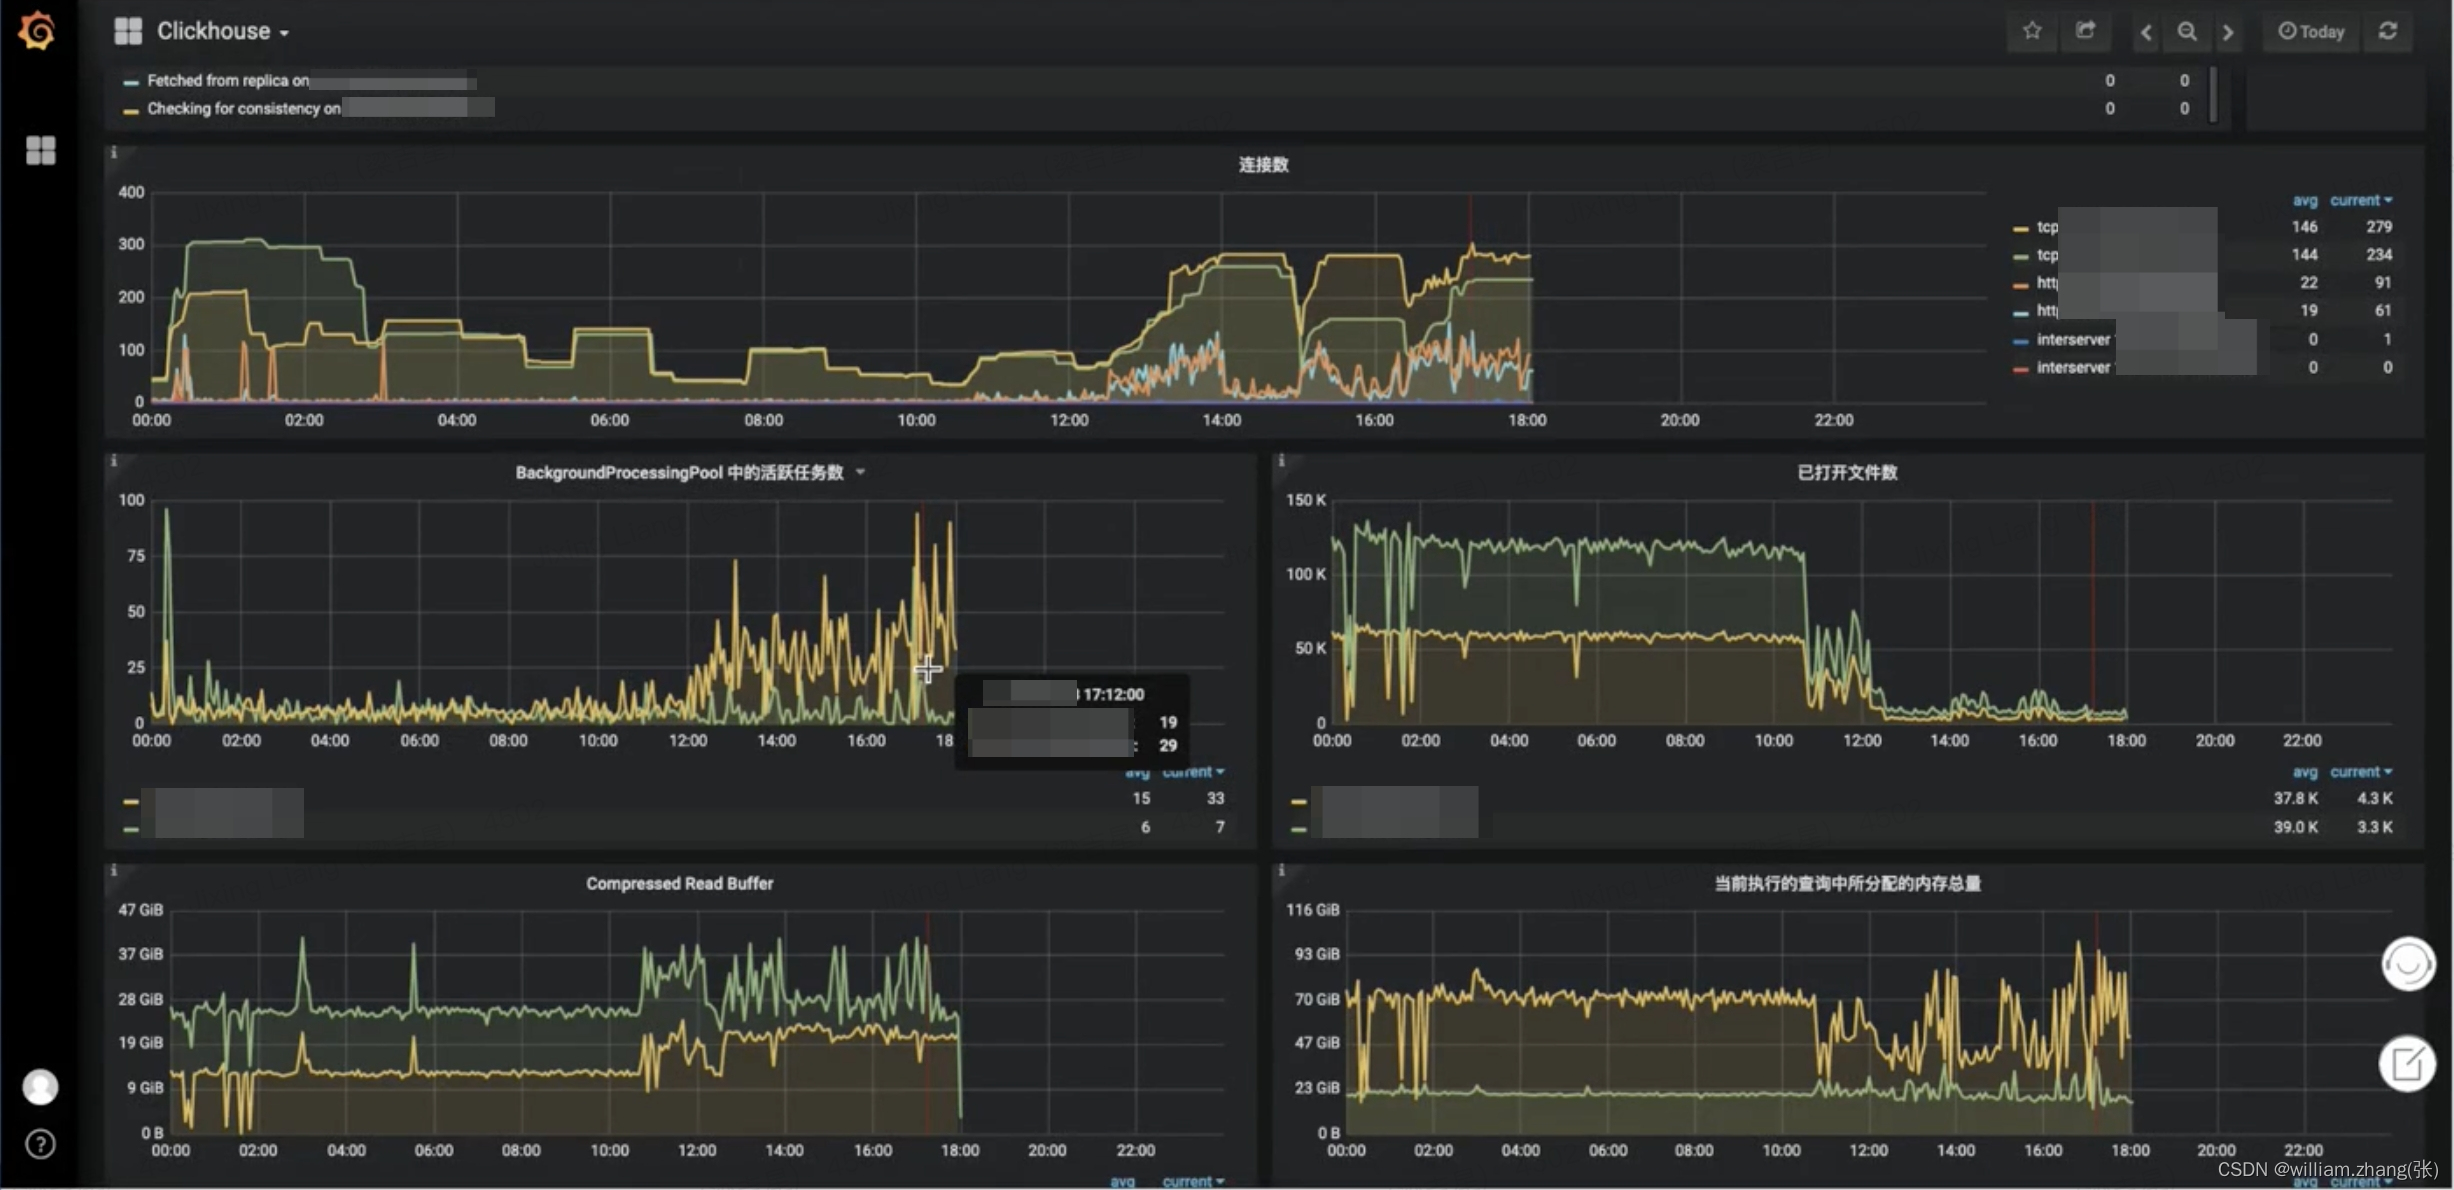
某客户现场的ClickHouse所在服务器资源占用率100%了,引发了服务器告警。观察Grafana监控面板发现,从12点左右出现了大量的碎片写入,从而引起了相关指标的快速上升。
本文主要通过ClickHouse官方的系统表system.query_log表进行问题排查定位,结合Grafana监控面板最终定位到问题根本原因。
 最近写入sql执行是否有异常,判断是否是因为批量的数据写入导致的CPU利用率突增
SELECT event_time, user, query_id AS query, read_rows, read_bytes, result_rows, result_bytes, memory_usage, exception FROM clusterAllReplicas('cluster_name', system, query_log) WHERE (event_date = today()) AND (event_time >= (now() - 60)) AND (is_initial_query = 1) AND (query NOT LIKE 'INSERT INTO%') ORDER BY event_time DESC LIMIT 100昨天有没有大于5分钟的慢查询
SELECT event_time, user, query_id AS query, read_rows, read_bytes, result_rows, result_bytes, memory_usage, exception FROM clusterAllReplicas('cluster_name', system, query_log) WHERE (event_date = yesterday()) AND query_duration_ms > 30000 AND (is_initial_query = 1) AND (query NOT LIKE 'INSERT INTO%') ORDER BY query_duration_ms desc LIMIT 100磁盘占用最高的前10张表
SELECT database, table, sum(bytes_on_disk) AS bytes_on_disk FROM clusterAllReplicas('cluster_name', system, parts) WHERE active AND (database != 'system') GROUP BY database, table ORDER BY bytes_on_disk DESC LIMIT 10查询频率前10的用户
SELECT user, count(1) AS query_times, sum(read_bytes) AS query_bytes, sum(read_rows) AS query_rows FROM clusterAllReplicas('cluster_name', system, query_log) WHERE (event_date = yesterday()) AND (is_initial_query = 1) AND (query NOT LIKE 'INSERT INTO%') GROUP BY user ORDER BY query_times DESC LIMIT 10统计SQL 查询次数,判断哪次查询时间最长以及查询的平均时长
select left(query, 100) as sql, count() as queryNum, sum(query_duration_ms) as totalTime, totalTime / queryNum as avgTime from system.query_log ql where event_time > toDateTime('2024-05-20 12:00:00') and event_time < toDateTime('2024-05-20 17:00:00') group by sql order by queryNum desc limit 10查询不包含insert into语句的5个小时查询次数超过1000次的 SQL
select * from ( select LEFT(query, 100) as sql, count() as quneryNum, sum(query_duration_ms) as totalTime, totalTime / queryNum as avgTime from system.query_log ql where event_time > toDateTime('2024-05-20 12:00:00') and event_time < toDateTime('2024-05-20 17:00:00') and query not like '%INSERT INTO%' group by sql order by avgTime desc) where queryNum > 1000 limit 50由于上述 SQL均做了截取,故需根据所查询 SQL 进一步匹配 SQL。
select query from system.query_log where event_time > toDateTime('2024-05-20 12:00:00') and event_time < toDateTime('2024-05-20 17:00:00') and query like '%需要匹配的sql查询%' limit 5;是否有left join查询,如果大表进行left join查询很可能导致CPU过高
select * from ( select LEFT(query,100) as sql, count() as quneryNum, sum(query_duration_ms) as totalTime, totalTime / queryNum as avgTime from system.query_log ql where sql like '%前面定位到的sql的信息%' and read_rows != 0 and event_time > toDateTime('2024-05-20 12:00:00') and event_time < toDateTime('2024-05-20 17:00:00') and query not like '%INSERT INTO%' group by sql order by queryNum desc)根据小时聚合每个小时查询次数耗时
select toHour(event_time) as t, count() as queryNum, sum(query_duration_ms) as totalTime, totalTime / queryNum as avgTime from system.query_log ql where event_time > toDateTime('2024-05-20 08:00:00') and event_time < toDateTime('2024-05-20 17:00:00') and query not like '%INSERT INTO%' and query like '%前面定位到的sql的信息%' and read_rows != 0 group by t limit 50根据小时聚合每个分钟查询次数耗时
select toMinute(event_time) as t, count() as queryNum, sum(query_duration_ms) as totalTime, totalTime / queryNum as avgTime from system.query_log ql where event_time > toDateTime('2024-05-20 12:00:00') and event_time < toDateTime('2024-05-20 13:00:00') and query not like '%INSERT INTO%' and query like '%前面定位到的sql的信息%' and read_rows != 0 group by t limit 50left join查询个数
select * from ( select LEFT(query,100) as sql, count() as quneryNum, sum(query_duration_ms) as totalTime, totalTime / queryNum as avgTime from system.query_log ql where query like '% JOIN%' and read_rows != 0 and event_time > toDateTime('2024-05-20 12:00:00') and event_time < toDateTime('2024-05-20 21:00:00') and query not like '%INSERT INTO%' group by sql order by queryNum desc)发现有问题的表时,查询该表结构
show create table "shard1"."xxx_replica"总结
遇到此类问题可先查看日志,首先在(Clickhouse 日志 Zookeeper 日志)日志中看能否找到有用的信息,例如直接报错信息等,如果在日志中找不到太多有用的信息的话,可以从下面入手。
一般遇到 CPU的load 值比较高的情况时,基本上都是因为查询引起的。当遇到这种问题时可先查询带有JOIN 的 SQL 语句是不是很多。
通过Grafana等监控工具,快速定位问题发生的时间段。
通过查询query_log表中的执行记录,分析是否有大查询、慢查询,找到具体的sql,条件允许的情况下可以停止大查询观察CPU的load值是否降低。(kill掉相关sql,KILL QUERY WHERE query_id='')
本次排查过程主要使用query_log表,下面为重要字段:
event_time— 查询开始时间.
query_duration_ms— 查询消耗的时间(毫秒).
read_rows— 从参与了查询的所有表和表函数读取的总行数.
query— 查询语句.
Clickhouse query_log 表中所有字段
type(Enum8) — 执行查询时的事件类型. 值:
'QueryStart' = 1— 查询成功启动.
'QueryFinish' = 2— 查询成功完成.
'ExceptionBeforeStart' = 3— 查询执行前有异常.
'ExceptionWhileProcessing' = 4— 查询执行期间有异常.
event_date(Date) — 查询开始日期.
event_time(DateTime) — 查询开始时间.
event_time_microseconds(DateTime64) — 查询开始时间(毫秒精度).
query_start_time(DateTime) — 查询执行的开始时间.
query_start_time_microseconds(DateTime64) — 查询执行的开始时间(毫秒精度).
query_duration_ms(UInt64) — 查询消耗的时间(毫秒).
read_rows(UInt64) — 从参与了查询的所有表和表函数读取的总行数. 包括:普通的子查询,IN和JOIN的子查询. 对于分布式查询read_rows包括在所有副本上读取的行总数。 每个副本发送它的read_rows值,并且查询的服务器-发起方汇总所有接收到的和本地的值。 缓存卷不会影响此值。
read_bytes(UInt64) — 从参与了查询的所有表和表函数读取的总字节数. 包括:普通的子查询,IN和JOIN的子查询. 对于分布式查询read_bytes包括在所有副本上读取的字节总数。 每个副本发送它的read_bytes值,并且查询的服务器-发起方汇总所有接收到的和本地的值。 缓存卷不会影响此值。
written_rows(UInt64) — 对于INSERT查询,为写入的行数。 对于其他查询,值为0。
written_bytes(UInt64) — 对于INSERT查询时,为写入的字节数。 对于其他查询,值为0。
result_rows(UInt64) —SELECT查询结果的行数,或INSERT的行数。
result_bytes(UInt64) — 存储查询结果的RAM量.
memory_usage(UInt64) — 查询使用的内存.
query(String) — 查询语句.
exception(String) — 异常信息.
exception_code(Int32) — 异常码.
stack_trace(String) — Stack Trace. 如果查询成功完成,则为空字符串。
is_initial_query(UInt8) — 查询类型. 可能的值:
1 — 客户端发起的查询.
0 — 由另一个查询发起的,作为分布式查询的一部分.
user(String) — 发起查询的用户.
query_id(String) — 查询ID.
address(IPv6) — 发起查询的客户端IP地址.
port(UInt16) — 发起查询的客户端端口.
initial_user(String) — 初始查询的用户名(用于分布式查询执行).
initial_query_id(String) — 运行初始查询的ID(用于分布式查询执行).
initial_address(IPv6) — 运行父查询的IP地址.
initial_port(UInt16) — 发起父查询的客户端端口.
interface(UInt8) — 发起查询的接口. 可能的值:
1 — TCP.
2 — HTTP.
os_user(String) — 运行 clickhouse-client的操作系统用户名.
client_hostname(String) — 运行clickhouse-client 或其他TCP客户端的机器的主机名。
client_name(String) — clickhouse-client 或其他TCP客户端的名称。
client_revision(UInt32) — clickhouse-client 或其他TCP客户端的Revision。
client_version_major(UInt32) — clickhouse-client 或其他TCP客户端的Major version。
client_version_minor(UInt32) — clickhouse-client 或其他TCP客户端的Minor version。
client_version_patch(UInt32) — clickhouse-client 或其他TCP客户端的Patch component。
http_method(UInt8) — 发起查询的HTTP方法. 可能值:
0 — TCP接口的查询.
1 —
GET2 —
POST
http_user_agent(String) — TheUserAgentThe UserAgent header passed in the HTTP request。
revision(UInt32) — ClickHouse revision.
ProfileEvents(Map(String, UInt64))) — Counters that measure different metrics. The description of them could be found in the table 系统。活动
Settings(Map(String, String)) — Names of settings that were changed when the client ran the query. To enable logging changes to settings, set thelog_query_settings参数为1。
thread_ids(Array(UInt64)) — 参与查询的线程数.
Settings.Names(Array(String)) — 客户端运行查询时更改的设置的名称。 要启用对设置的日志记录更改,请将log_query_settings参数设置为1。
Settings.Values(Array(String)) —Settings.Names列中列出的设置的值
