阅读量:0
文章目录
前言
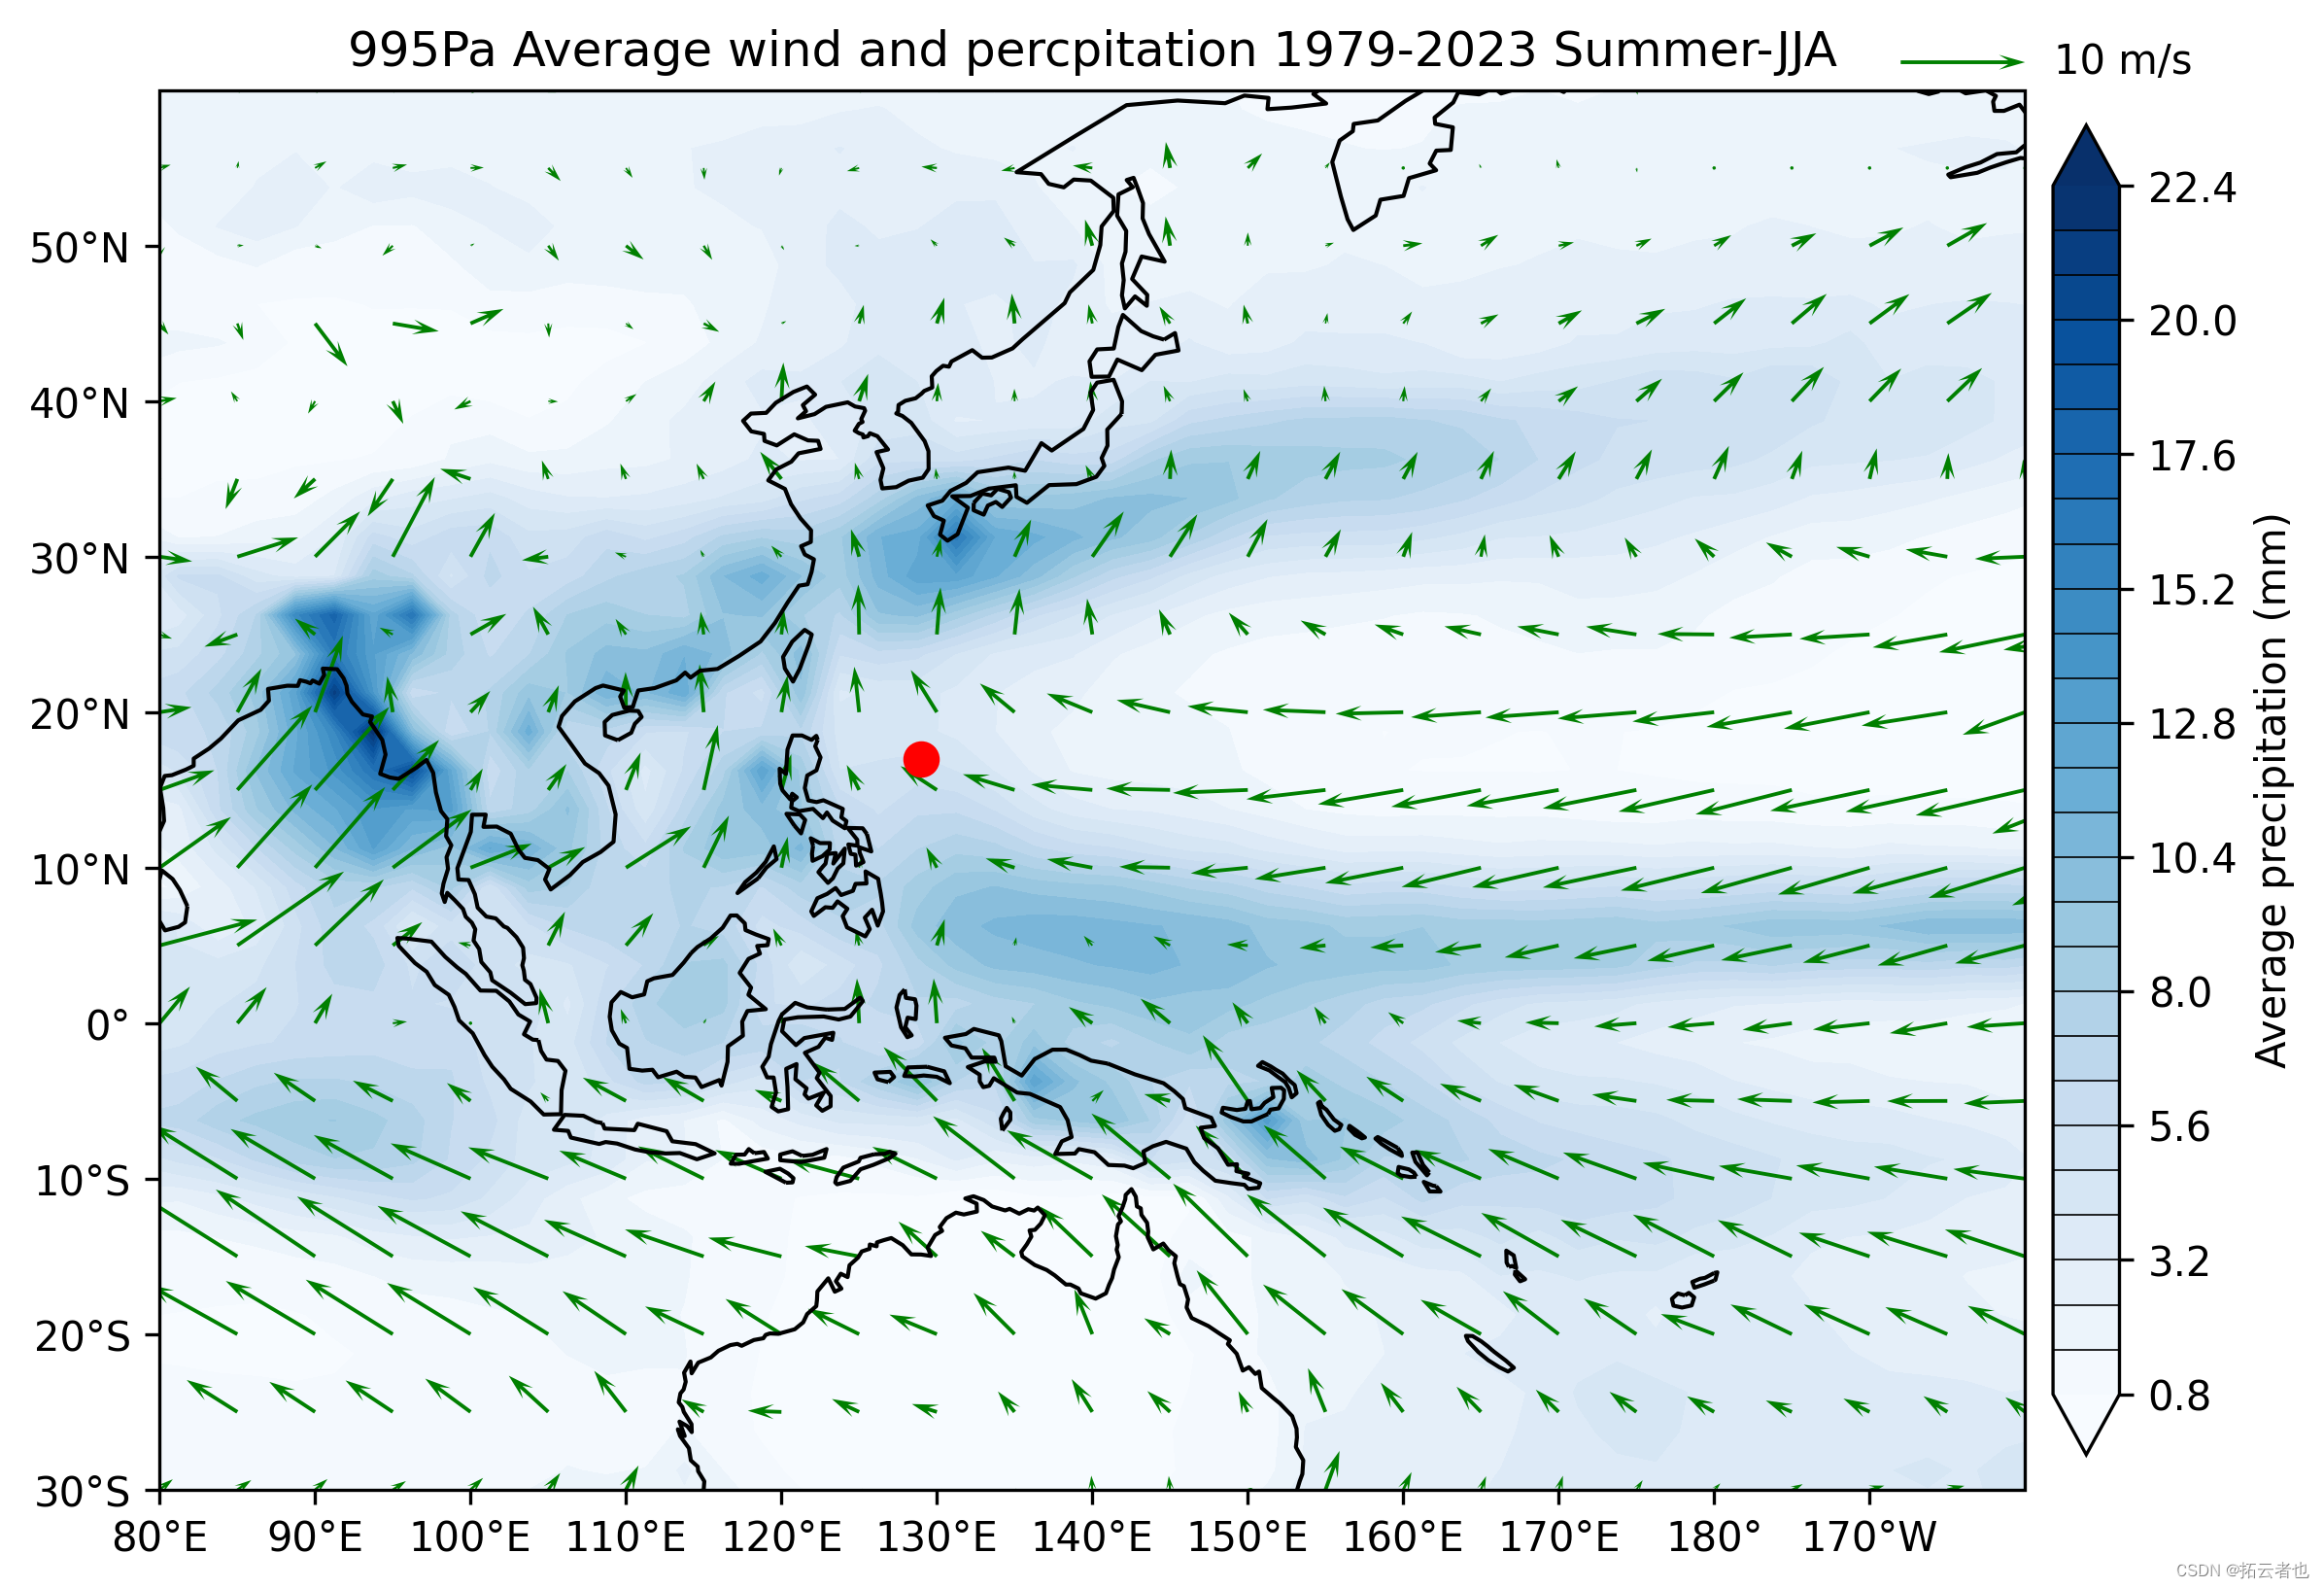
绘制西太和亚洲区域夏季和冬季平均风速风向矢量图,并叠加平均降雨填充底图
一、下载再分析网格数据
1,风速风向数据,主要是在美国的NASA网站下载的NCEP\NCAR数据集,包含了1948-至今平均逐月的数据(u_wnd.nc; v_wnd.nc).下载链接(https://psl.noaa.gov/data/gridded/data.ncep.reanalysis.html),具体步骤可以参考这篇博文(https://blog.csdn.net/qq_58252159/article/details/131946548)
2, 降雨数据也是,下载链接(https://psl.noaa.gov/data/gridded/data.gpcc.html#detail)
二、具体步骤
1.引入库
代码如下:
import xarray as xr import numpy as np import datetime as dt import cartopy.crs as ccrs import cartopy.feature as cfeature import cartopy.mpl.ticker as cticker import matplotlib.pyplot as plt 2.读入数据并筛选数据
代码如下:
import xarray as xr import numpy as np import datetime as dt import cartopy.crs as ccrs import cartopy.feature as cfeature import cartopy.mpl.ticker as cticker import matplotlib.pyplot as plt # 导入降雨数据 f_p = xr.open_dataset('C:\\Users\\huain\\Desktop\\BY\\precip.mon.mean.nc') #筛选降雨数据冬季的月份 p = f_p.precip.loc[f_p.time.dt.month.isin([6,7,8])].loc['1979-01-01':'2023-12-01'] p_cli = np.array(p).reshape(45,3,72,144).mean((0)) lats = f_p.lat lons = f_p.lon #导入纬向风的数据 f_u = xr.open_dataset('C:\\Users\\huain\\Desktop\\BY\\uwnd.mon.mean.nc') #筛选冬季纬向风的数据 u = f_u.uwnd.loc[f_u.time.dt.month.isin([6,7,8])].loc['1979-01-01':'2023-12-01'] u_cli = np.array(u).reshape(45,3,73,144).mean((0)) lat = f_u.lat lon = f_u.lon #导入经向风的数据 f_v = xr.open_dataset('C:\\Users\\huain\\Desktop\\BY\\vwnd.mon.mean.nc') #筛选冬季经向风的数据 v = f_v.vwnd.loc[f_v.time.dt.month.isin([6,7,8])].loc['1979-01-01':'2023-12-01'] v_cli = np.array(v).reshape(45,3,73,144).mean((0)) #计算风速 windspeed = np.sqrt(u_cli**2 + v_cli**2) # ax.quiver(lon[::2],lat[::2],u_cli[0,::2,::2],v_cli[0,::2,::2],transform=ccrs.PlateCarree(),scale=150,color='r') #画图 fig = plt.figure(figsize=(12,8)) proj = ccrs.PlateCarree(central_longitude=180) leftlon, rightlon, lowerlat, upperlat = (80,200,-30,60) img_extent = [leftlon, rightlon, lowerlat, upperlat] ax = fig.add_axes([0.1, 0.1, 0.8, 0.6],projection = proj) ax.set_extent(img_extent, crs=ccrs.PlateCarree()) ax.add_feature(cfeature.COASTLINE) ax.set_xticks(np.arange(leftlon,rightlon,10), crs=ccrs.PlateCarree()) ax.set_yticks(np.arange(lowerlat,upperlat,10), crs=ccrs.PlateCarree()) lon_formatter = cticker.LongitudeFormatter() lat_formatter = cticker.LatitudeFormatter() ax.xaxis.set_major_formatter(lon_formatter) ax.yaxis.set_major_formatter(lat_formatter) q = ax.quiver(lon[::2],lat[::2],u_cli[0,::2,::2],v_cli[0,::2,::2],transform=ccrs.PlateCarree(),scale=150,color='g',width=0.002,headwidth=4,headlength=7) #添加风速比例尺 ax.quiverkey(q, 1, 1.02, 10, '10 m/s', labelpos='E',coordinates='axes') #添加图名 ax.set_title('995Pa Average wind and percpitation 1979-2023 Summer-JJA') #绘制降雨填充图 c = ax.contourf(lons,lats,p_cli[0], cmap='Blues', levels=30, extend='both', add_colorbar=True, transform=ccrs.PlateCarree(),zorder=0) # 添加颜色条 cbar = fig.colorbar(c, drawedges=True, ax=ax, location='right', shrink=0.95, pad=0.01, spacing='uniform', label='Average precipitation (mm)') cbar.ax.tick_params(labelsize=10) # 设置色标尺标签大小 # 添加一个采样点位(129°E,17°N) sample_point = ax.plot(129, 17, 'ro', transform=ccrs.PlateCarree(), markersize=8) # 为采样点添加标签 ax.annotate('WPS-1/2', xy=(129, 17), xytext=(20, 20), textcoords='offset points', ha='left', va='bottom', bbox=dict(boxstyle='round', fc='w', ec='0.5', lw=2), arrowprops=dict(facecolor='black', arrowstyle='->'), transform=ccrs.PlateCarree()) 三、效果图

