阅读量:0
一、基础
echarts官网:快速上手 - 使用手册 - Apache ECharts
推荐一个各种图表的网站:https://madeapie.com/
安装引入配置暂省略
1 准备一个DOM容器(定义一个 <div> 节点),一定要有宽高(可以是%)
<template> <div id="main" style="width: 600px;height:400px;"></div> </template>2 初始化的时候,传入该节点 echarts.init , 监听图表容器的大小并改变图表大小。
this.myChart= echarts.init( document.getElementById("main") ); window.addEventListener('resize', function() { this.myChart.resize(); });3 准备配置项 、可以在图表组件中去调接口获取数据(我是在父组件获取的数据传过来,于是就是watch里面监听然后展示)
4 使用指定的配置项和数据展示图表 myChart.setOption(option)
汇总:
<script> export default { name: "", props: { // 父组件传的数据 XXXXXX: { type: Object, default: () => {} }, }, data() { return { XXXChart:null, }; }, watch: { // 监听数据变化 更新图表 XXXXXX(newVal, oldVal){ this.initChart(); } }, mounted() { // 初始化实例 this.XXXChart = echarts.init( document.getElementById("myChart") ); // 改变图表大小 window.addEventListener("resize", function() { this.XXXChart.resize(); }); }, methods: { initChart() { let option = {} this.XXXChart.setOption(option); }, } }; 二、多系列柱状图
配置项:
let option = { // 标题 title: { text: 'XXXXXX', }, // 图例 legend: { right:15, // 让图例靠右 可以是数值 也可以是"%" }, // 提示框 tooltip: { trigger: 'axis', // 触发类型 axis-坐标轴触发(主要在柱状图,折线图等会使用类目轴的图表中使用) // 坐标轴指示器配置项 axisPointer: { type: 'shadow' } }, // 绘图网格 grid: { left: '3%', // 离容器左侧的距离 right: '4%',// 离容器右侧的距离 bottom: '3%',// 离容器下侧的距离 containLabel: true // grid 区域是否包含坐标轴的刻度标签 }, // X轴 xAxis: { type: 'category', // 坐标轴类型为category-类目轴 data: this.XXXXXX.XXX //类目数据[] }, // Y轴 yAxis: { type: 'value', // 坐标轴类型为数值轴 minInterval: 1, // 最小间隔大小 因为此项目该数据不可能有小数 所以设置为1 boundaryGap: [0, '20%'] //坐标轴两边留白策略 非类目轴是是一个两个值的数组,分别表示数据最小值和最大值的延伸范围,可以直接设置数值或者相对的百分比 }, // 系列 有几个系列写几组 series: [ { name: '内部', // 系列名称,用于tooltip的显示,legend的图例筛选 type: 'bar', // bar-柱状图 itemStyle:{ // 图形样式。 //柱条颜色 color: 'rgba(115,160,250,1)', }, data: this.XXXXXX.AAAA //数据内容数组 }, { name: '外部', type: 'bar', itemStyle:{ color: 'rgba(115,222,179,1)', }, data: this.XXXXXX.BBBB } ] };效果图:

三、堆叠柱状图
配置项:
let option = { // 标题 title: { text: 'XXX', textStyle: { color: "#436EEE", // 主标题文字的颜色 fontSize: 17, // 主标题文字的字体大小 } }, // 提示框 tooltip : { trigger: 'axis', // 坐标轴触发 axisPointer : { // 坐标轴指示器,坐标轴触发有效 type : 'shadow' } }, // 图例 legend: { data:['有效','过期'], // 如果图例跟系列的name对应 完全可以不用写 right:15, // 离容器右侧的距离 可让图例偏右 textStyle: { // 图例的公用文本样式 color: 'rgba(217,217,217,1)' } }, // 网格 grid: { left: '3%', // 离容器左侧的距离 right: '4%',// 离容器右侧的距离 bottom: '3%',// 离容器下侧的距离 containLabel: true // grid 区域是否包含坐标轴的刻度标签 }, // X轴 xAxis : [ { type : 'category', // 类目轴 data : this.XXX.AA, // 类目数据 //splitLine: { //坐标轴在 grid 区域中的分隔线。默认类目轴不显示 // show: false //}, // axisLine: { // lineStyle: { // 坐标轴线线的颜色 // color: 'rgba(217,217,217,1)', // } // }, // axisLabel: { // 刻度标签文字的颜色 // color: 'rgba(121,121,121,1)' // } } ], // Y轴 yAxis : [ { type : 'value', // 数值轴 minInterval:1, // 最小间隔大小 因为此项目该数据不可能有小数 所以设置为1 boundaryGap: [0, '20%'] //坐标轴两边留白策略 非类目轴是是一个两个值的数组,分别表示数据最小值和最大值的延伸范围,可以直接设置数值或者相对的百分比 splitLine: { // 坐标轴在 grid 区域中的分隔线。 show: true }, // axisLine: { // lineStyle: { // 坐标轴线线的颜色 // color: 'rgba(217,217,217,1)', // } // } } ], series : [ { name: '有效', type: 'bar', // 柱状图 barWidth: 20, //柱条的宽度,不设时自适应。 stack: '证书', // 数据堆叠,同个类目轴上系列配置相同的 stack 值可以堆叠放置。 itemStyle: { color: 'rgba(115,160,250,1)' // 柱条的颜色 }, data: this.xxxx.AAA }, { name: '过期', type: 'bar', barWidth: 20, stack: '证书', itemStyle: { color: 'rgba(115,222,179,1)' }, data: this.xxxx.bb } ] };效果图:

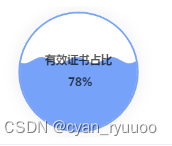
四、水球图
水球图需要额外插件:
可以npm安装: 注意兼容性 (echarts-liquidfill@3 与Echarts5兼容, echarts-liquidfill@2 与 Echarts4兼容) 我们系统原本的echarts 是4.2.1 就选这个2.0.6。 然后引入import 'echarts-liquidfill'
npm install echarts-liquidfill@2.0.6 --save开发的时候感觉npm好慢 于是直接下载的js 引入的(已上传资源),这一块具体也不清楚对不对 :我只用了里面src下的文件 在图表组件中 import '@/路径/echarts-liquidfill-2.0.6/src/liquidFill.js' 反正能正常显示
配置项:
let option = { series: [{ type: 'liquidFill', // 水球图 radius: '80%', // 水球图半径 调整大小 center: ['50%', '50%'], //图表相对于盒子的位置 第一个是水平的位置 第二个是垂直的值 默认是[50%,50%]是在水平和垂直方向居中 可以设置百分比 也可以设置具体值 shape: 'circle', //修改形状,同时还支持svg图作为形状:'path://........' waveAnimation: 10, // 动画时长 phase: 0, // 波的相位弧度 默认情况下是自动 amplitude: 5, // 振幅 0为平面 waveLength: "30%", // 因为原型波浪比较密 设置这个可以调节出效果 // 水球样式 itemStyle: { color: 'rgba(119,162,250,1)', // 水球颜色 opacity: 1, // 水球透明度 shadowBlur: 0 // 波浪的阴影范围 }, // 设置水球图内部背景 backgroundStyle: { // borderColor: '#4348EC', // borderWidth: 10 color: "#fff",//水球图内部背景色 }, // 设置圈内文本样式 label: { normal: { insideColor: '#333', // 水波内部字体颜色 看有的文档写在textStyle里 但是我这不生效 写在这个位置可以生效 color: '#333', // 背景处文本颜色 fontSize: 18, // 字体大小 position: ['50%', '50%'],//圈中文字的位置 formatter: `有效证书占比\n\n ${this.XX.xxx}`, //默认显示百分比数据 重新编写水球内部文本 也可以function(param) {return ......}, } }, //外部轮廓 outline: { show: true, // 是否显示外圈 borderDistance: 0, // 外部轮廓与图表的距离 数字 itemStyle: { // 外部轮廓样式 borderWidth: 3, // 外部轮廓宽度 borderColor: 'rgba(119,162,250,1)', // 外部轮廓颜色 //shadowBlur: 20, // 外部轮廓阴影范围 //shadowColor: 'rgba(0, 0, 0, 0.25)' // 外部轮廓阴影颜色 } }, // 水球图数组数据可以简单的写数值,也可以为一个对象(单独设置某项样式)。显示多个波浪, 数值value须从大到小排列, data: [{ name: 'score', // 水球图数据名称 direction: 'right',// 水球图数据方向 value: 0.6, // 水球图数据值 itemStyle: { // 水球图数据样式 opacity: 1, // 水球图数据透明度 normal: { // color: 'rgba(119,162,250,1)', // 水球图数据颜色 } }, }], color: ['rgba(119,162,250,1)'], emphasis:{ itemStyle: { opacity :1 //鼠标经过波浪颜色的透明度 } }, }], }效果图:

