
阅读量:0
面插值计算效果展示:

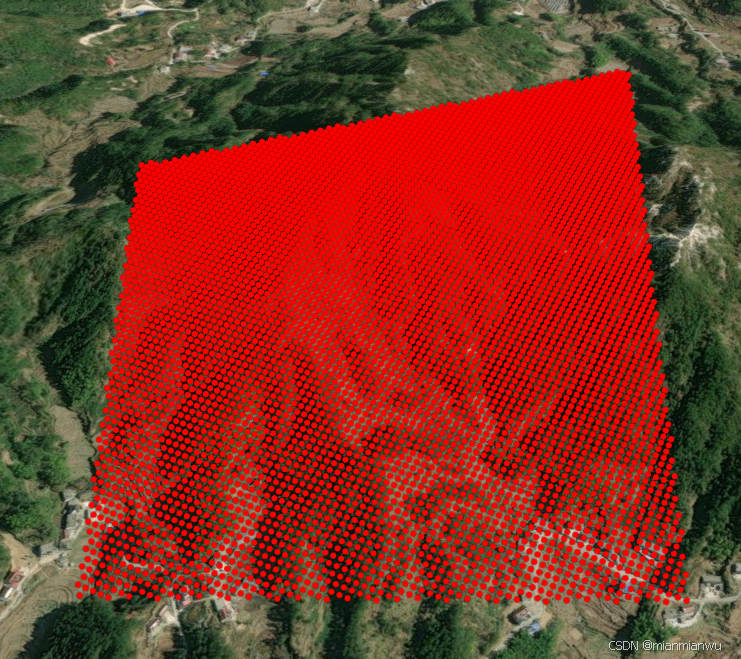
(离屏渲染方式)面插值效果展示:
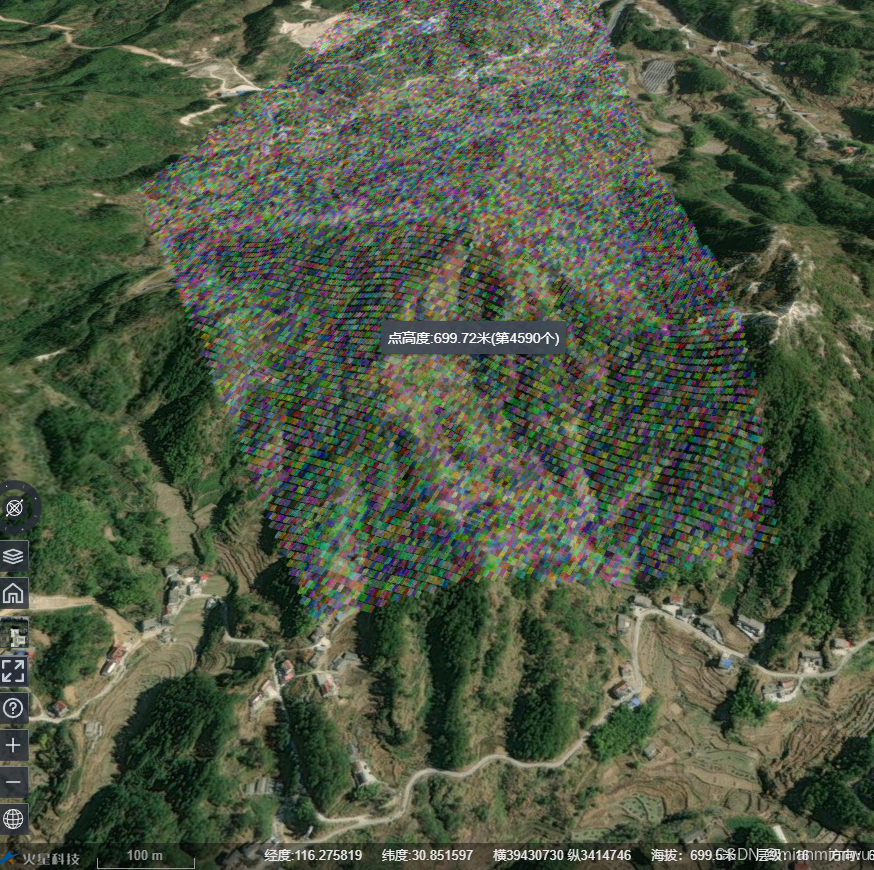
面内插值计算插点效果展示:
线插值效果展示:

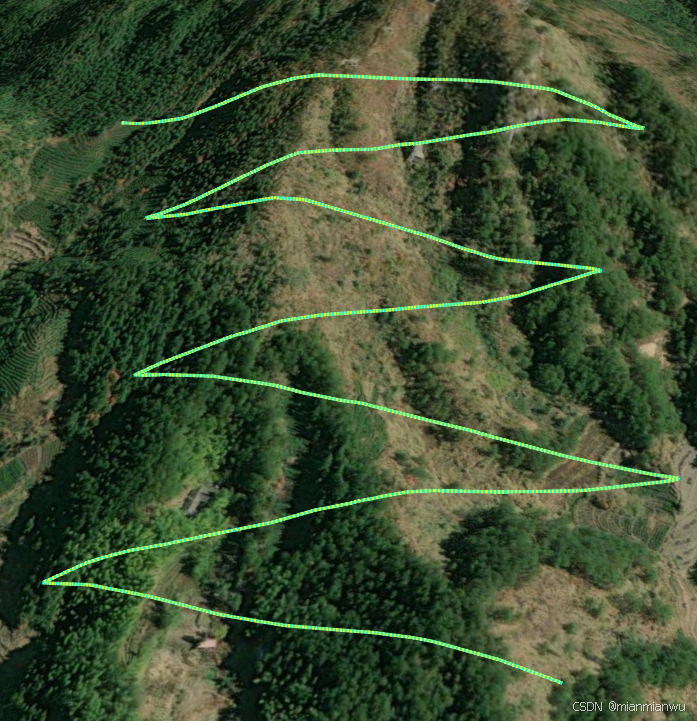
(离屏渲染方式)高密度线内插值计算效果展示:
相关代码:
import * as mars3d from "mars3d" export let map // mars3d.Map三维地图对象 // 需要覆盖config.json中地图属性参数(当前示例框架中自动处理合并) export const mapOptions = { scene: { center: { lat: 30.841762, lng: 116.26537, alt: 3281, heading: 39, pitch: -63 } } } /** * 初始化地图业务,生命周期钩子函数(必须) * 框架在地图初始化完成后自动调用该函数 * @param {mars3d.Map} mapInstance 地图对象 * @returns {void} 无 */ export function onMounted(mapInstance) { map = mapInstance // 记录map } /** * 释放当前地图业务的生命周期函数 * @returns {void} 无 */ export function onUnmounted() { map = null } export function removeAll() { map.graphicLayer.clear() clearInterResult() } /** * 面插值 * * @export * @param {number} val 步长 * @returns {void} */ export async function interPolygon(val) { const graphic = await map.graphicLayer.startDraw({ type: "polygon", style: { color: "#29cf34", opacity: 0.3, outline: true, outlineColor: "#ffffff", clampToGround: true } }) const positions = graphic.positionsShow map.graphicLayer.clear() const resultInter = await mars3d.PolyUtil.interPolygon({ scene: map.scene, positions, splitNum: val // splitNum插值分割的个数 }) showInterPolygonResult(resultInter.list) } function showInterPolygonResult(list) { clearInterResult() // 分析结果用于测试分析的,不做太多处理,直接清除之前的,只保留一个 let pt1, pt2, pt3 const arrData = [] for (let i = 0, len = list.length; i < len; i++) { const item = list[i] pt1 = item.point1.pointDM pt2 = item.point2.pointDM pt3 = item.point3.pointDM // 点 for (const pt of [item.point1, item.point2, item.point3]) { const graphic = new mars3d.graphic.PointPrimitive({ position: pt.pointDM, style: { pixelSize: 9, color: Cesium.Color.fromCssColorString("#ff0000").withAlpha(0.5) } }) interGraphicLayer.addGraphic(graphic) graphic.bindTooltip("点高度:" + mars3d.MeasureUtil.formatDistance(pt.height)) } // 横截面面积 item.area = item.area || mars3d.MeasureUtil.getTriangleArea(pt1, pt2, pt3) item.index = i // 三角网及边线 arrData.push({ positions: [pt1, pt2, pt3, pt1], style: { color: Cesium.Color.fromRandom({ alpha: 0.6 }) }, attr: item }) } // 三角网面(单击用) const primitivePoly = new mars3d.graphic.PolygonCombine({ instances: arrData, highlight: { type: mars3d.EventType.click, color: Cesium.Color.YELLOW.withAlpha(0.9) } }) interGraphicLayer.addGraphic(primitivePoly) primitivePoly.bindTooltip(function (event) { const item = event.pickedObject?.data?.attr if (!item) { return } return "三角面积:" + mars3d.MeasureUtil.formatArea(item.area) + "(第" + item.index + "个)" }) // 三角网边线 const primitiveLine = new mars3d.graphic.PolylineCombine({ instances: arrData, highlight: { type: mars3d.EventType.click, color: Cesium.Color.YELLOW.withAlpha(0.9) } }) interGraphicLayer.addGraphic(primitiveLine) } export async function interPolygonGrid(val) { clearInterResult() const graphic = await map.graphicLayer.startDraw({ type: "polygon", style: { color: "#29cf34", opacity: 0.3, outline: true, outlineColor: "#ffffff" } }) const positions = graphic.positionsShow map.graphicLayer.clear() const result = mars3d.PolyUtil.getGridPointsByPoly(positions, val) result.forEach((p, i) => { const graphic = new mars3d.graphic.PointPrimitive({ position: p, style: { color: "#ff0000", pixelSize: 6 } }) interGraphicLayer.addGraphic(graphic) }) } /** * 面插值 * * @export * @param {number} val 步长 * @returns {void} */ export async function interPolygonByDepth(val) { const graphic = await map.graphicLayer.startDraw({ type: "polygon", style: { color: "#29cf34", opacity: 0.3, outline: true, outlineColor: "#ffffff", clampToGround: true } }) const positions = graphic.positionsShow map.graphicLayer.clear() updateAllGraphicShow(map, false) const resultInter = await mars3d.PolyUtil.interPolygonByDepth({ scene: map.scene, positions, splitNum: val // splitNum插值分割的个数 }) updateAllGraphicShow(map, true) showInterPolygonByDepthResult(resultInter) } function showInterPolygonByDepthResult(resultInter) { clearInterResult() // 分析结果用于测试分析的,不做太多处理,直接清除之前的,只保留一个 const arrData = [] for (let i = 0, len = resultInter.count; i < len; i++) { const position = resultInter.positions[i] // const graphic = new mars3d.graphic.PointPrimitive({ // position: position, // style: { // pixelSize: 9, // color: Cesium.Color.fromCssColorString("#ff0000").withAlpha(0.5) // } // }) // interGraphicLayer.addGraphic(graphic) // graphic.bindTooltip("点高度:" + mars3d.MeasureUtil.formatDistance(position.height)) arrData.push({ positions: position.getOutline(), style: { color: Cesium.Color.fromRandom({ alpha: 0.4 }) }, attr: { height: position.height, index: i } }) } const primitivePoly = new mars3d.graphic.PolygonCombine({ instances: arrData, highlight: { type: mars3d.EventType.click, color: Cesium.Color.YELLOW.withAlpha(0.9) } }) interGraphicLayer.addGraphic(primitivePoly) primitivePoly.bindTooltip(function (event) { const item = event.pickedObject?.data?.attr if (!item) { return } return "点高度:" + mars3d.MeasureUtil.formatDistance(item.height) + "(第" + item.index + "个)" }) } // 线插值 export async function interPolyline(val) { const graphic = await map.graphicLayer.startDraw({ type: "polyline", style: { color: "#55ff33", width: 3, clampToGround: true } }) const positions = graphic.positionsShow map.graphicLayer.clear() const arrLine = mars3d.PolyUtil.interPolyline({ scene: map.scene, positions, splitNum: val // 插值分割的个数 }) showInterLineResult(arrLine) } // 高度等分 export async function interLine(val) { const graphic = await map.graphicLayer.startDraw({ type: "polyline", style: { color: "#55ff33", width: 3 } }) const positions = graphic.positionsShow map.graphicLayer.clear() const arrLine = mars3d.PolyUtil.interLine(positions, { splitNum: val // 插值分割的个数 }) showInterLineResult(arrLine) } export async function interLineByDepth(val) { const graphic = await map.graphicLayer.startDraw({ type: "polyline", style: { color: "#55ff33", width: 3 } }) const positions = graphic.positionsShow map.graphicLayer.clear() updateAllGraphicShow(map, false) const resultInter = await mars3d.PolyUtil.interPolylineByDepth({ scene: map.scene, positions, splitNum: val // 插值分割的个数 }) updateAllGraphicShow(map, true) showInterLineResult(resultInter.positions) } // 显示影藏矢量数据 function updateAllGraphicShow(map, show) { map.eachLayer((layer) => { if (layer.type === "graphic") { layer.show = show } }) } // 显示mars3d.polygon.interPolygon处理后的面内插值分析结果,主要用于测试对比 // 显示面的插值计算结果,方便比较分析 let interGraphicLayer function clearInterResult() { if (!interGraphicLayer) { interGraphicLayer = new mars3d.layer.GraphicLayer() map.addLayer(interGraphicLayer) } interGraphicLayer.clear() } // function showInterLineResult(list) { clearInterResult() // 分析结果用于测试分析的,不做太多处理,直接清除之前的,只保留最后一个 const colorList = [Cesium.Color.fromCssColorString("#ffff00"), Cesium.Color.fromCssColorString("#00ffff")] const arrData = [] for (let i = 1, len = list.length; i < len; i++) { const pt1 = list[i - 1] const pt2 = list[i] const color = colorList[i % 2] arrData.push({ positions: [pt1, pt2], style: { width: 3, color, depthFailColor: color }, attr: { distance: Cesium.Cartesian3.distance(pt1, pt2), index: i } }) } const primitiveLine = new mars3d.graphic.PolylineCombine({ instances: arrData, highlight: { type: mars3d.EventType.click, color: Cesium.Color.RED } }) interGraphicLayer.addGraphic(primitiveLine) primitiveLine.bindTooltip(function (event) { const item = event.pickedObject?.data?.attr if (!item) { return } return "长度:" + mars3d.MeasureUtil.formatDistance(item.distance) + "(第" + item.index + "个)" }) } 