引言
在机器学习中,逻辑回归是一种用于二分类问题的方法。它使用逻辑函数(也称为sigmoid函数)来预测属于某个类别的概率。逻辑回归的损失函数通常是交叉熵损失,用于衡量预测值与真实值之间的差异
文章目录
一、逻辑回归的梯度下降
1.1 逻辑回归的梯度下降算法的Python代码示例
这段代码将展示如何计算损失函数的梯度,并更新模型参数
#!/usr/bin/env python # -*- coding: utf-8 -*- # @Time : 2024/8/2 22:31 # @Software: PyCharm # @Author : xialiwei # @Email : xxxxlw198031@163.com import numpy as np # sigmoid函数,用于逻辑回归的预测 def sigmoid(z): return 1 / (1 + np.exp(-z)) # 逻辑回归的损失函数 def log_loss(h, y): return (-y * np.log(h) - (1 - y) * np.log(1 - h)).mean() # 计算梯度 def compute_gradient(X, y, w, b): m = len(y) z = np.dot(X, w) + b h = sigmoid(z) error = h - y dw = (1/m) * np.dot(X.T, error) db = (1/m) * np.sum(error) return dw, db # 梯度下降算法 def gradient_descent(X, y, w_init, b_init, learning_rate, num_iterations): w = w_init b = b_init for i in range(num_iterations): dw, db = compute_gradient(X, y, w, b) w -= learning_rate * dw b -= learning_rate * db # 可选:打印损失值,以便观察收敛情况 if i % 100 == 0: z = np.dot(X, w) + b h = sigmoid(z) loss = log_loss(h, y) print(f"Iteration {i}: Loss {loss}") return w, b # 示例数据(这里需要你自己准备数据集X和标签y) # X = ... # 特征矩阵,形状为 (num_samples, num_features) # y = ... # 标签向量,形状为 (num_samples,) X_train = np.array([[0.5, 1.5], [1,1], [1.5, 0.5], [3, 0.5], [2, 2], [1, 2.5]]) y_train = np.array([0, 0, 0, 1, 1, 1]) # 初始化参数 w_init = np.zeros(X_train.shape[1]) b_init = 0 # 设置学习率和迭代次数 learning_rate = 0.01 num_iterations = 9000 # 执行梯度下降 w_final, b_final = gradient_descent(X_train, y_train, w_init, b_init, learning_rate, num_iterations) 1.2 代码解释
在这个代码中:
sigmoid函数用于计算逻辑回归的预测值log_loss函数用于计算损失compute_gradient函数用于计算损失函数关于模型参数的梯度- 最后
gradient_descent函数实现了梯度下降算法,通过迭代更新模型参数
1.3 代码注意点
- 这段代码是一个简化的示例,实际应用中可能需要对数据进行预处理,比如特征缩放,并且可能需要添加正则化项来防止过拟合
- 学习率、迭代次数和其他超参数可能需要根据具体问题进行调整
二、逻辑回归的梯度下降
2.1 导入第三方库
import copy, math import numpy as np %matplotlib widget import matplotlib.pyplot as plt from lab_utils_common import dlc, plot_data, plt_tumor_data, sigmoid, compute_cost_logistic from plt_quad_logistic import plt_quad_logistic, plt_prob plt.style.use('./deeplearning.mplstyle') 2.2 数据集
从决策边界实验中使用的同一个双特征数据集开始
X_train = np.array([[0.5, 1.5], [1,1], [1.5, 0.5], [3, 0.5], [2, 2], [1, 2.5]]) y_train = np.array([0, 0, 0, 1, 1, 1]) 像之前一样,我们将使用一个辅助函数来绘制这些数据。标签为𝑦=1的数据点用红色十字表示,而标签为𝑦=0的数据点用蓝色圆圈表示。
fig,ax = plt.subplots(1,1,figsize=(4,4)) plot_data(X_train, y_train, ax) ax.axis([0, 4, 0, 3.5]) ax.set_ylabel('$x_1$', fontsize=12) ax.set_xlabel('$x_0$', fontsize=12) plt.show() 输出结果: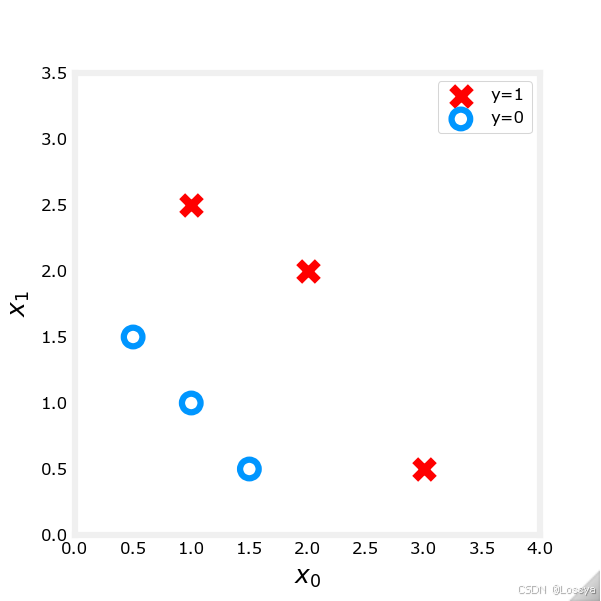
2.3 逻辑梯度下降
回忆一下,梯度下降算法利用梯度计算:
重复直到收敛:
repeat until convergence: { w j = w j − α ∂ J ( w , b ) ∂ w j for j := 0..n-1 b = b − α ∂ J ( w , b ) ∂ b } \begin{align*} &\text{repeat until convergence:} \; \lbrace \\ & \; \; \;w_j = w_j - \alpha \frac{\partial J(\mathbf{w},b)}{\partial w_j} \tag{1} \; & \text{for j := 0..n-1} \\ & \; \; \; \; \;b = b - \alpha \frac{\partial J(\mathbf{w},b)}{\partial b} \\ &\rbrace \end{align*} repeat until convergence:{wj=wj−α∂wj∂J(w,b)b=b−α∂b∂J(w,b)}for j := 0..n-1(1)
每次迭代都对所有的𝑤𝑗执行同时更新,其中
∂ J ( w , b ) ∂ w j = 1 m ∑ i = 0 m − 1 ( f w , b ( x ( i ) ) − y ( i ) ) x j ( i ) ∂ J ( w , b ) ∂ b = 1 m ∑ i = 0 m − 1 ( f w , b ( x ( i ) ) − y ( i ) ) \begin{align*} \frac{\partial J(\mathbf{w},b)}{\partial w_j} &= \frac{1}{m} \sum\limits_{i = 0}^{m-1} (f_{\mathbf{w},b}(\mathbf{x}^{(i)}) - y^{(i)})x_{j}^{(i)} \tag{2} \\ \frac{\partial J(\mathbf{w},b)}{\partial b} &= \frac{1}{m} \sum\limits_{i = 0}^{m-1} (f_{\mathbf{w},b}(\mathbf{x}^{(i)}) - y^{(i)}) \tag{3} \end{align*} ∂wj∂J(w,b)∂b∂J(w,b)=m1i=0∑m−1(fw,b(x(i))−y(i))xj(i)=m1i=0∑m−1(fw,b(x(i))−y(i))(2)(3)
- m m m是数据集中的训练示例数量
- f w , b ( x ( i ) ) f_{\mathbf{w},b}(x^{(i)}) fw,b(x(i))是模型的预测,而 y ( i ) y^{(i)} y(i)是目标值
- 对于逻辑回归模型
– z = w ⋅ x + b z = \mathbf{w} \cdot \mathbf{x} + b z=w⋅x+b
– f w , b ( x ) = g ( z ) f_{\mathbf{w},b}(x) = g(z) fw,b(x)=g(z)
– 其中𝑔(𝑧)是sigmoid函数: g ( z ) = 1 1 + e − z g(z) = \frac{1}{1+e^{-z}} g(z)=1+e−z1
2.4 梯度下降实现
梯度下降算法实现包含两个部分:
- 实现上述方程(1)的循环。这是下面的gradient_descent,通常在可选和实践实验中提供给您
- 计算当前梯度,上述方程(2,3)。这是compute_gradient_logistic。这周您将在实践实验中实现这个
2.5 计算梯度的代码描述
实现上述方程(2,3)对于所有的𝑤𝑗和𝑏。有很多种实现方式。下面是其中一种:
初始化变量以累积dj_dw和dj_db,对于每个示例,计算该示例的错误𝑔(𝐰⋅𝐱(𝑖)+𝑏)−𝐲(𝑖),对于该示例中的每个输入值𝑥(𝑖)𝑗,,将错误乘以输入𝑥(𝑖)𝑗,并加到dj_dw的对应元素上。(方程2)将错误加到dj_db上(方程3)将dj_db和dj_dw除以示例总数(m)
注意,在numpy中𝐱(𝑖)是X[i,:]或X[i],而𝑥(𝑖)𝑗是X[i,j]
def compute_gradient_logistic(X, y, w, b): """ Computes the gradient for linear regression Args: X (ndarray (m,n): Data, m examples with n features y (ndarray (m,)): target values w (ndarray (n,)): model parameters b (scalar) : model parameter Returns dj_dw (ndarray (n,)): The gradient of the cost w.r.t. the parameters w. dj_db (scalar) : The gradient of the cost w.r.t. the parameter b. """ m,n = X.shape dj_dw = np.zeros((n,)) #(n,) dj_db = 0. for i in range(m): f_wb_i = sigmoid(np.dot(X[i],w) + b) #(n,)(n,)=scalar err_i = f_wb_i - y[i] #scalar for j in range(n): dj_dw[j] = dj_dw[j] + err_i * X[i,j] #scalar dj_db = dj_db + err_i dj_dw = dj_dw/m #(n,) dj_db = dj_db/m #scalar return dj_db, dj_dw 检查以下代码中梯度函数的实现
X_tmp = np.array([[0.5, 1.5], [1,1], [1.5, 0.5], [3, 0.5], [2, 2], [1, 2.5]]) y_tmp = np.array([0, 0, 0, 1, 1, 1]) w_tmp = np.array([2.,3.]) b_tmp = 1. dj_db_tmp, dj_dw_tmp = compute_gradient_logistic(X_tmp, y_tmp, w_tmp, b_tmp) print(f"dj_db: {dj_db_tmp}" ) print(f"dj_dw: {dj_dw_tmp.tolist()}" ) 输出结果:
预期结果:
dj_db: 0.49861806546328574
dj_dw: [0.498333393278696, 0.49883942983996693]
结论:输出结果与预期结果一致
2.6 梯度下降法代码
下面是实现上述方程(1)的代码。
将程序中的函数与上面的方程进行比较。
def gradient_descent(X, y, w_in, b_in, alpha, num_iters): """ Performs batch gradient descent Args: X (ndarray (m,n) : Data, m examples with n features y (ndarray (m,)) : target values w_in (ndarray (n,)): Initial values of model parameters b_in (scalar) : Initial values of model parameter alpha (float) : Learning rate num_iters (scalar) : number of iterations to run gradient descent Returns: w (ndarray (n,)) : Updated values of parameters b (scalar) : Updated value of parameter """ # An array to store cost J and w's at each iteration primarily for graphing later J_history = [] w = copy.deepcopy(w_in) #avoid modifying global w within function b = b_in for i in range(num_iters): # Calculate the gradient and update the parameters dj_db, dj_dw = compute_gradient_logistic(X, y, w, b) # Update Parameters using w, b, alpha and gradient w = w - alpha * dj_dw b = b - alpha * dj_db # Save cost J at each iteration if i<100000: # prevent resource exhaustion J_history.append( compute_cost_logistic(X, y, w, b) ) # Print cost every at intervals 10 times or as many iterations if < 10 if i% math.ceil(num_iters / 10) == 0: print(f"Iteration {i:4d}: Cost {J_history[-1]} ") return w, b, J_history #return final w,b and J history for graphing 在我们的数据集上跑梯度下降的代码
w_tmp = np.zeros_like(X_train[0]) b_tmp = 0. alph = 0.1 iters = 10000 w_out, b_out, _ = gradient_descent(X_train, y_train, w_tmp, b_tmp, alph, iters) print(f"\nupdated parameters: w:{w_out}, b:{b_out}") 输出结果: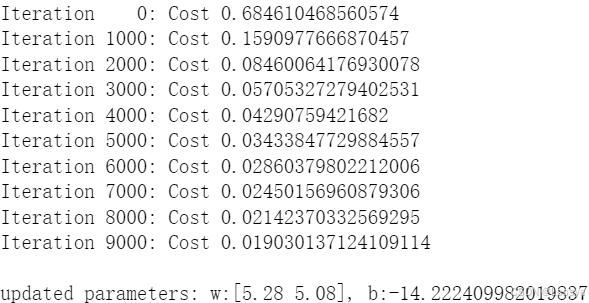
绘制梯度下降结果的代码:
fig,ax = plt.subplots(1,1,figsize=(5,4)) # plot the probability plt_prob(ax, w_out, b_out) # Plot the original data ax.set_ylabel(r'$x_1$') ax.set_xlabel(r'$x_0$') ax.axis([0, 4, 0, 3.5]) plot_data(X_train,y_train,ax) # Plot the decision boundary x0 = -b_out/w_out[1] x1 = -b_out/w_out[0] ax.plot([0,x0],[x1,0], c=dlc["dlblue"], lw=1) plt.show() 绘制结果: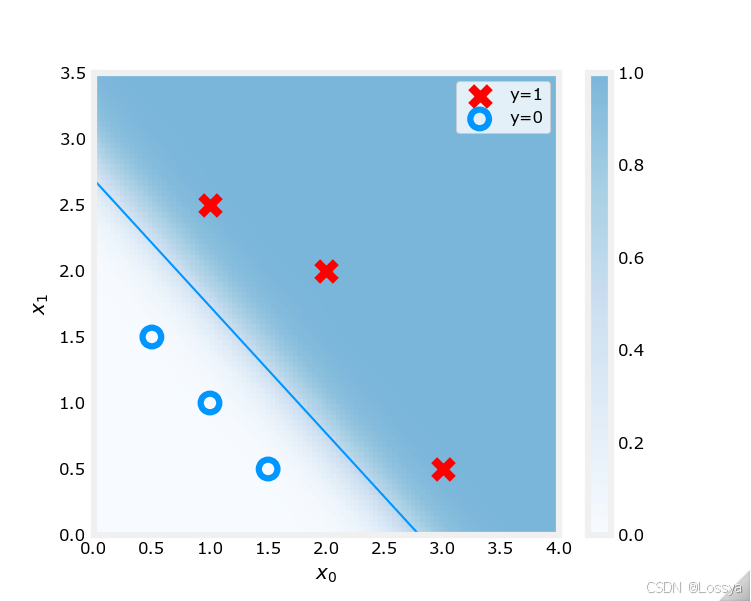
在上面的图中:
- 着色反映了概率y=1(在决策边界之前的结果)
- 决策边界是概率等于0.5的线
2.7 另一个数据集
让我们回到一个一变量数据集。只有两个参数,𝑤和𝑏,我们可以在等高线图中绘制成本函数,以更好地了解梯度下降在做什么。
x_train = np.array([0., 1, 2, 3, 4, 5]) y_train = np.array([0, 0, 0, 1, 1, 1]) 我们将使用一个辅助函数来绘制这些数据。标签为𝑦=1的数据点用红色十字表示,而标签为𝑦=0的数据点用蓝色圆圈表示
fig,ax = plt.subplots(1,1,figsize=(4,3)) plt_tumor_data(x_train, y_train, ax) plt.show() 绘制结果: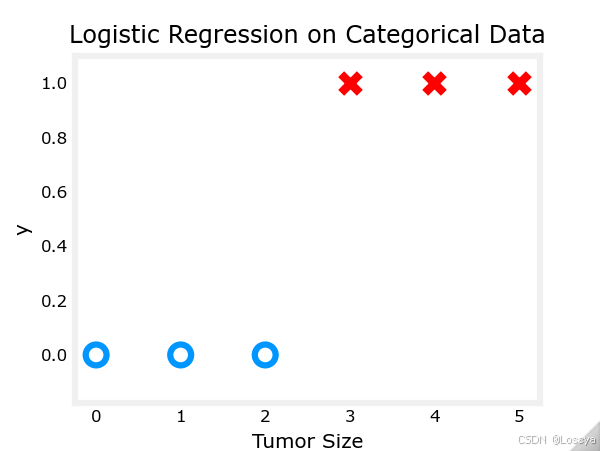
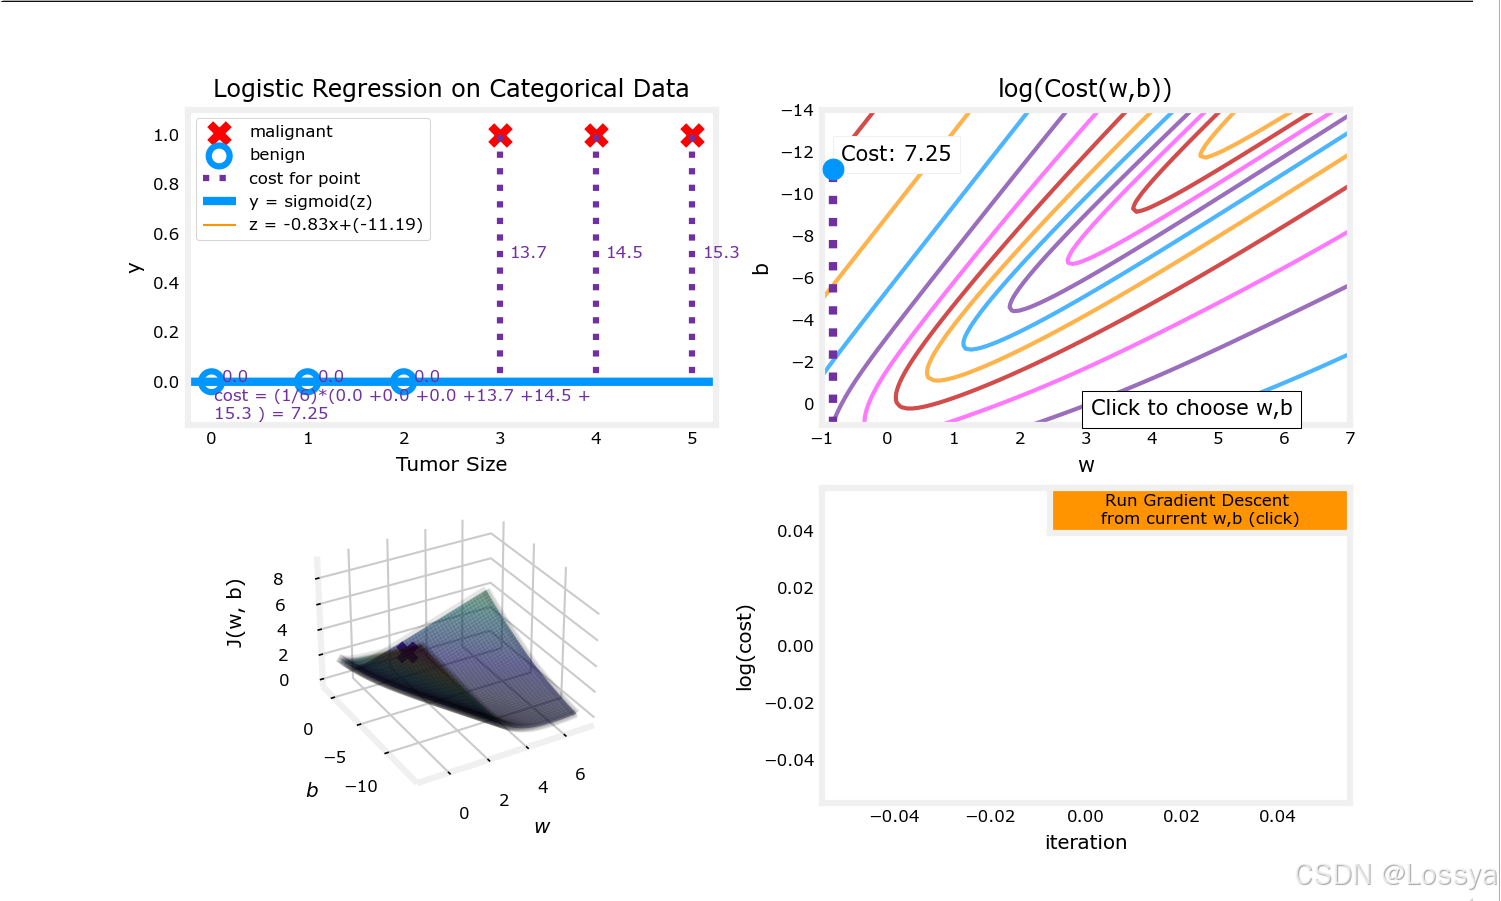
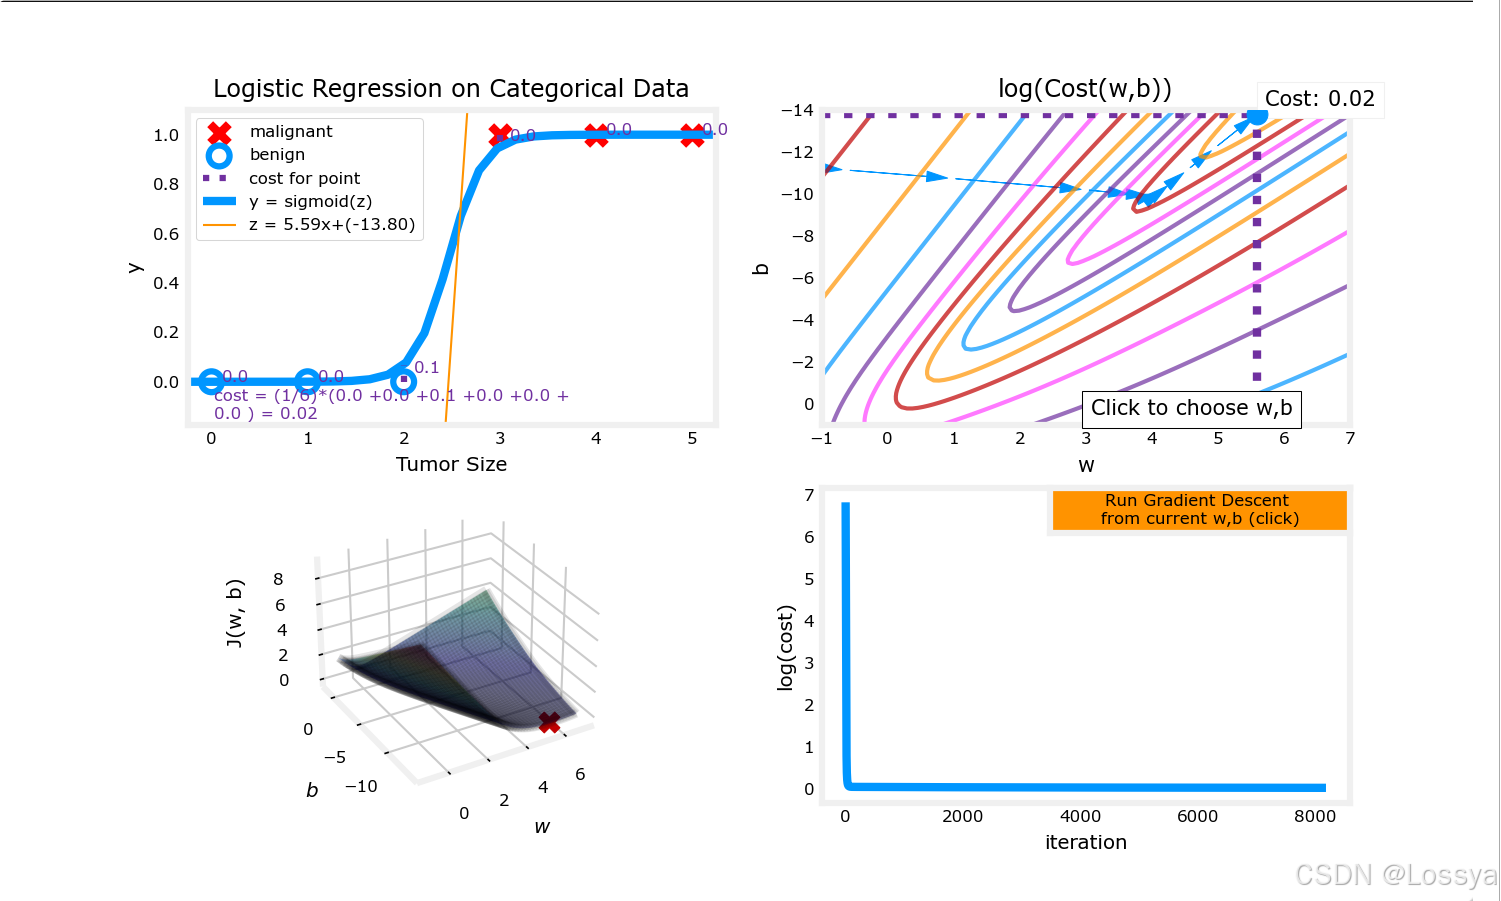
在下面的图中,尝试:
- 通过点击上右角的等高线图来更改𝑤和𝑏
– 更改可能需要一秒钟或两秒钟
– 注意上左图中的成本值的变化
– 注意成本是通过每个示例的损失累积的(垂直虚线) - 通过点击橙色按钮运行梯度下降
– 注意成本稳步下降(等高线和成本图以对数成本显示)
– 在等高线图中点击将重置模型以进行新的运行
– 要重置图表,重新运行此单元格
w_range = np.array([-1, 7]) b_range = np.array([1, -14]) quad = plt_quad_logistic( x_train, y_train, w_range, b_range ) 绘制结果:
- 运行梯度下降前:
- 运行梯度下降后:
2.8 总结
- 检查了逻辑回归的梯度计算公式和实现,在这些例行程序中进行了探索一变量数据集、两变量数据集
- 更新逻辑回归的梯度下降算法
- 在一个熟悉的数据集上探索梯度下降
