
阅读量:0
有需要本项目的代码或文档以及全部资源,或者部署调试可以私信博主
抓取天气网站


以下是部分代码展示
import matplotlib.pyplot as plt # 设置中文字体 plt.rcParams['axes.unicode_minus'] = False # 不使用中文减号 plt.rcParams['font.sans-serif'] = 'FangSong' # 设置字体为仿宋(FangSong) import pandas as pd file_path = 'weather_info.csv' weather_data = pd.read_csv(file_path) # Displaying the first few rows of the dataset to understand its structure weather_data.head() | ymd | high | low | tianqi | fengxiang | fengli | aqi | aqiInfo | aqiLevel | train_level | Province | City | |
|---|---|---|---|---|---|---|---|---|---|---|---|---|
| 0 | 1/1/2020 | 5 | 0 | 多云 | 东南风 | 1级 | 72.0 | 良 | 2.0 | 0 | 河南省 | 郑州 |
| 1 | 2/1/2020 | 7 | -1 | 多云 | 东南风 | 1级 | 120.0 | 轻度污染 | 3.0 | 0 | 河南省 | 郑州 |
| 2 | 3/1/2020 | 10 | -2 | 阴~多云 | 东南风 | 1级 | 183.0 | 中度污染 | 4.0 | 0 | 河南省 | 郑州 |
| 3 | 4/1/2020 | 11 | 1 | 多云~中雨 | 东南风 | 2级 | 242.0 | 重度污染 | 5.0 | 2 | 河南省 | 郑州 |
| 4 | 5/1/2020 | 2 | 0 | 雨夹雪 | 东北风 | 3级 | 274.0 | 重度污染 | 5.0 | 0 | 河南省 | 郑州 |
from datetime import datetime import numpy as np import matplotlib.pyplot as plt # 数据清洗:删除含有空值的数据行 cleaned_data = weather_data.dropna() # 数据字段扩充:将日期字段转换为年、月、日和星期 cleaned_data['date'] = pd.to_datetime(cleaned_data['ymd'], format='%d/%m/%Y') cleaned_data['year'] = cleaned_data['date'].dt.year cleaned_data['month'] = cleaned_data['date'].dt.month cleaned_data['day'] = cleaned_data['date'].dt.day cleaned_data['weekday'] = cleaned_data['date'].dt.day_name() # 显示清洗和扩充后的数据 cleaned_data.head() | ymd | high | low | tianqi | fengxiang | fengli | aqi | aqiInfo | aqiLevel | train_level | Province | City | date | year | month | day | weekday | |
|---|---|---|---|---|---|---|---|---|---|---|---|---|---|---|---|---|---|
| 0 | 1/1/2020 | 5 | 0 | 多云 | 东南风 | 1级 | 72.0 | 良 | 2.0 | 0 | 河南省 | 郑州 | 2020-01-01 | 2020 | 1 | 1 | Wednesday |
| 1 | 2/1/2020 | 7 | -1 | 多云 | 东南风 | 1级 | 120.0 | 轻度污染 | 3.0 | 0 | 河南省 | 郑州 | 2020-01-02 | 2020 | 1 | 2 | Thursday |
| 2 | 3/1/2020 | 10 | -2 | 阴~多云 | 东南风 | 1级 | 183.0 | 中度污染 | 4.0 | 0 | 河南省 | 郑州 | 2020-01-03 | 2020 | 1 | 3 | Friday |
| 3 | 4/1/2020 | 11 | 1 | 多云~中雨 | 东南风 | 2级 | 242.0 | 重度污染 | 5.0 | 2 | 河南省 | 郑州 | 2020-01-04 | 2020 | 1 | 4 | Saturday |
| 4 | 5/1/2020 | 2 | 0 | 雨夹雪 | 东北风 | 3级 | 274.0 | 重度污染 | 5.0 | 0 | 河南省 | 郑州 | 2020-01-05 | 2020 | 1 | 5 | Sunday |
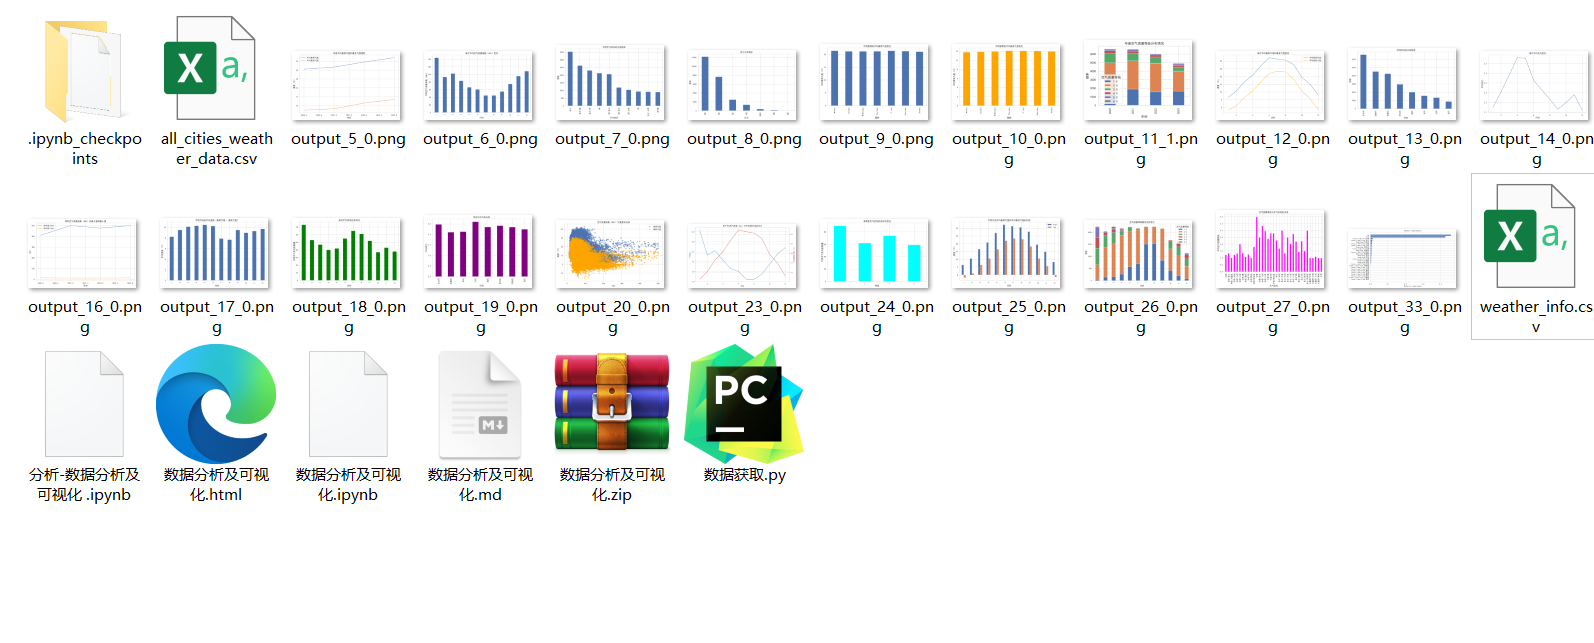
年度平均最高气温和最低气温趋势: 年度平均最高气温和最低气温趋势图显示了每年的平均最高和最低温度的变化。 如果存在年度数据,可以观察到随时间的推移,温度是否呈现上升或下降趋势,这可能反映了气候变化的影响。 每月平均空气质量指数(AQI)变化: 该图展示了不同月份的平均AQI值。 通过这个分析,可以识别出空气质量较差和较好的月份,这可能与特定的季节性活动或气候条件有关。 不同天气状况的出现频率: 展示了记录期间各种天气状况出现的频率。 这可以帮助理解该地区的主要天气模式,例如最常见的天气状况是多云、晴朗还是下雨。 风力分布情况: 描述了不同风力等级的出现次数。 通过这个分析,可以了解该地区常见的风力强度,以及极端风力事件的频率。 不同星期的平均最高气温变化: 显示了一周内不同天的平均最高温度。 这可以帮助观察是否存在工作日和周末之间的显著温度差异,这可能与人类活动模式有关。 不同星期的平均最低气温变化: 显示了一周内不同天的平均最低温度。 类似于最高温度分析,这也可以揭示工作日和周末的温度差异。 年度空气质量等级分布情况: 描述了不同年份中各种空气质量等级的分布。 这有助于识别空气质量的长期趋势,例如是否有改善或恶化的迹象。 每月平均最高气温和最低气温变化: 展示了一年中不同月份的平均最高和最低温度。 这有助于理解季节性温度变化,包括最热和最冷的月份。 不同风向的出现频率: 显示了不同风向的统计频率。 这有助于理解主导风向,以及风向变化是否与季节变化有关。 每月平均风力变化: 描述了一年中不同月份的平均风力。 这可以揭示风力的季节性模式,例如某些月份是否通常风力更强或更弱。 # 设置图表的全局参数 plt.rcParams['font.sans-serif'] = ['SimHei'] # 用于正常显示中文标签 plt.rcParams['axes.unicode_minus'] = False # 用于正常显示负号 plt.rcParams['figure.dpi'] = 300 # 设置图像的dpi # 1. 年度平均最高气温和最低气温趋势 plt.figure(figsize=(10, 6)) cleaned_data.groupby('year')['high'].mean().plot(kind='line', label='平均最高气温') cleaned_data.groupby('year')['low'].mean().plot(kind='line', label='平均最低气温') plt.title('年度平均最高气温和最低气温趋势') plt.xlabel('年份') plt.ylabel('温度 (℃)') plt.legend() plt.show() # 数据分割 X_train, X_test, y_train, y_test = train_test_split(X, y, test_size=0.2, random_state=42) X_train | high | low | fengli | fengxiang | tianqi_simplified | |
|---|---|---|---|---|---|
| 8442 | 28 | 23 | 3级 | 东北风 | 阴 |
| 24340 | 6 | -1 | 1级 | 东南风 | 多云 |
| 16978 | 31 | 24 | 2级 | 南风 | 阴 |
| 5094 | 28 | 19 | 3级 | 东北风 | 雾 |
| 11480 | 36 | 25 | 3级 | 东南风 | 多云 |
| ... | ... | ... | ... | ... | ... |
| 21575 | 22 | 10 | 3级 | 南风 | 多云 |
| 5390 | 34 | 24 | 2级 | 西南风 | 多云 |
| 860 | 21 | 12 | 2级 | 南风 | 晴 |
| 15795 | 3 | 0 | 3级 | 东风 | 阴 |
| 23654 | 8 | -4 | 2级 | 西北风 | 阴 |
19713 rows × 5 columns
# 预处理和模型管道 preprocessor = ColumnTransformer( transformers=[ ('num', StandardScaler(), ['high', 'low']), ('cat', OneHotEncoder(), ['fengxiang', 'tianqi_simplified']) ]) # 定义模型 models = { 'RandomForest': RandomForestClassifier(random_state=42), 'SVC': SVC(random_state=42), 'LogisticRegression': LogisticRegression(random_state=42) } # 训练和评估模型 for name, model in models.items(): pipeline = Pipeline([ ('preprocessor', preprocessor), ('smote', SMOTE(random_state=42)), ('classifier', model) ]) pipeline.fit(X_train, y_train) y_pred = pipeline.predict(X_test) accuracy = accuracy_score(y_test, y_pred) print(f"Model: {name}") print("Accuracy:", accuracy) print("Classification Report:") print(classification_report(y_test, y_pred)) print("\n") Model: RandomForest Accuracy: 0.7841347129235139 Classification Report: precision recall f1-score support 0 0.88 0.85 0.86 3940 1 0.47 0.52 0.49 989 accuracy 0.78 4929 macro avg 0.67 0.69 0.68 4929 weighted avg 0.79 0.78 0.79 4929
Model: SVC Accuracy: 0.7108947048082775 Classification Report: precision recall f1-score support 0 0.95 0.67 0.79 3940 1 0.40 0.87 0.55 989 accuracy 0.71 4929 macro avg 0.68 0.77 0.67 4929 weighted avg 0.84 0.71 0.74 4929
Model: LogisticRegression Accuracy: 0.7210387502536011 Classification Report: precision recall f1-score support 0 0.93 0.71 0.80 3940 1 0.40 0.78 0.53 989 accuracy 0.72 4929 macro avg 0.66 0.74 0.67 4929 weighted avg 0.82 0.72 0.75 4929
import pandas as pd import numpy as np import matplotlib.pyplot as plt from sklearn.model_selection import train_test_split from sklearn.preprocessing import LabelEncoder, StandardScaler, OneHotEncoder from sklearn.compose import ColumnTransformer from sklearn.ensemble import RandomForestClassifier from sklearn.metrics import classification_report, accuracy_score from imblearn.over_sampling import SMOTE from imblearn.pipeline import Pipeline # 训练随机森林模型 pipeline = Pipeline([ ('preprocessor', preprocessor), ('smote', SMOTE(random_state=42)), ('classifier', RandomForestClassifier(random_state=42)) ]) pipeline.fit(X_train, y_train) # 特征重要性可视化 try: onehot_columns = pipeline.named_steps['preprocessor'].named_transformers_['cat'].get_feature_names(input_features=['fengxiang', 'tianqi_simplified']) except AttributeError: onehot_columns = pipeline.named_steps['preprocessor'].named_transformers_['cat'].get_feature_names() feature_names = np.concatenate([['high', 'low'], onehot_columns]) importances = pipeline.named_steps['classifier'].feature_importances_ indices = np.argsort(importances) plt.figure(figsize=(10, 6)) plt.title('Feature Importances') plt.barh(range(len(indices)), importances[indices], color='b', align='center') plt.yticks(range(len(indices)), [feature_names[i] for i in indices]) plt.xlabel('Relative Importance') plt.show() 每文一语
加油
