
阅读量:0
1. 架构概述
SpotBugs的架构设计主要围绕以下几个核心组件展开:
- 分析引擎:这是SpotBugs的核心,负责读取Java字节码(.class文件),并应用预定义的规则集来检测潜在的代码问题。
- 规则集:一组预定义的规则,用于识别特定的代码缺陷和错误模式。SpotBugs的规则集是可扩展的,允许用户添加自定义规则。
- 用户界面:提供与用户交互的界面,展示分析结果,并提供修改建议。SpotBugs支持多种集成方式,包括作为IDE插件、Maven/Gradle插件或独立应用程序。
- 插件系统:允许第三方开发者扩展SpotBugs的功能,通过添加新的检测器或规则集来增强其对特定类型错误的检测能力。
2. 分析引擎
分析引擎是SpotBugs架构中的核心部分,它执行以下关键任务:
- 字节码解析:SpotBugs首先读取Java字节码文件,这些文件包含了编译后的Java程序信息。
- 模式匹配:将解析后的字节码与预定义的错误模式进行匹配。这些模式基于常见的编程错误、空指针引用、资源泄漏、线程安全问题等。
- 问题报告:一旦检测到问题,分析引擎会生成详细的报告,包括问题的描述、位置、可能的影响以及修复建议。
3. 规则集与可扩展性
SpotBugs的规则集是其灵活性和可扩展性的关键。规则集定义了SpotBugs能够检测的错误类型,以及如何检测这些错误。
- 内置规则集:SpotBugs提供了丰富的内置规则集,覆盖了常见的编程错误和安全问题。
- 自定义规则:用户可以根据需要创建自定义规则,以检测特定的代码问题。这种机制使得SpotBugs能够适应不同的项目需求。
- 插件扩展:通过插件系统,第三方开发者可以添加新的检测器或规则集,从而扩展SpotBugs的功能。
4. 用户界面与集成
SpotBugs提供了多种用户界面和集成方式,以满足不同用户和开发环境的需求。
- IDE插件:SpotBugs可以作为Eclipse、IntelliJ IDEA等主流IDE的插件使用,方便开发人员在编写代码的同时进行静态分析。
- 构建工具集成:SpotBugs可以与Maven、Gradle等构建工具集成,作为构建过程的一部分自动执行静态分析。
- 独立应用程序:SpotBugs还提供了独立的应用程序版本,允许用户在不依赖IDE或构建工具的情况下进行静态分析。
5. 性能优化
为了提高分析效率和准确性,SpotBugs在架构设计中考虑了性能优化:
- 增量分析:SpotBugs支持增量分析,即只对新修改的代码进行分析,而不是对整个项目进行分析。这可以显著减少分析时间。
- 并行处理:SpotBugs利用多核处理器的优势,通过并行处理来提高分析速度。
- 缓存机制:SpotBugs采用缓存机制来存储分析结果,以便在后续分析中快速检索和重用。
源码解析
下面就从源码的角度,对 spotbugs 的工作原理一探究竟。
首先,从github下载源码 https://github.com/spotbugs/spotbugs.git
将源码导入到 IDEA 中,并构建 gradle 工程。
完成后,打开启动类 Driver: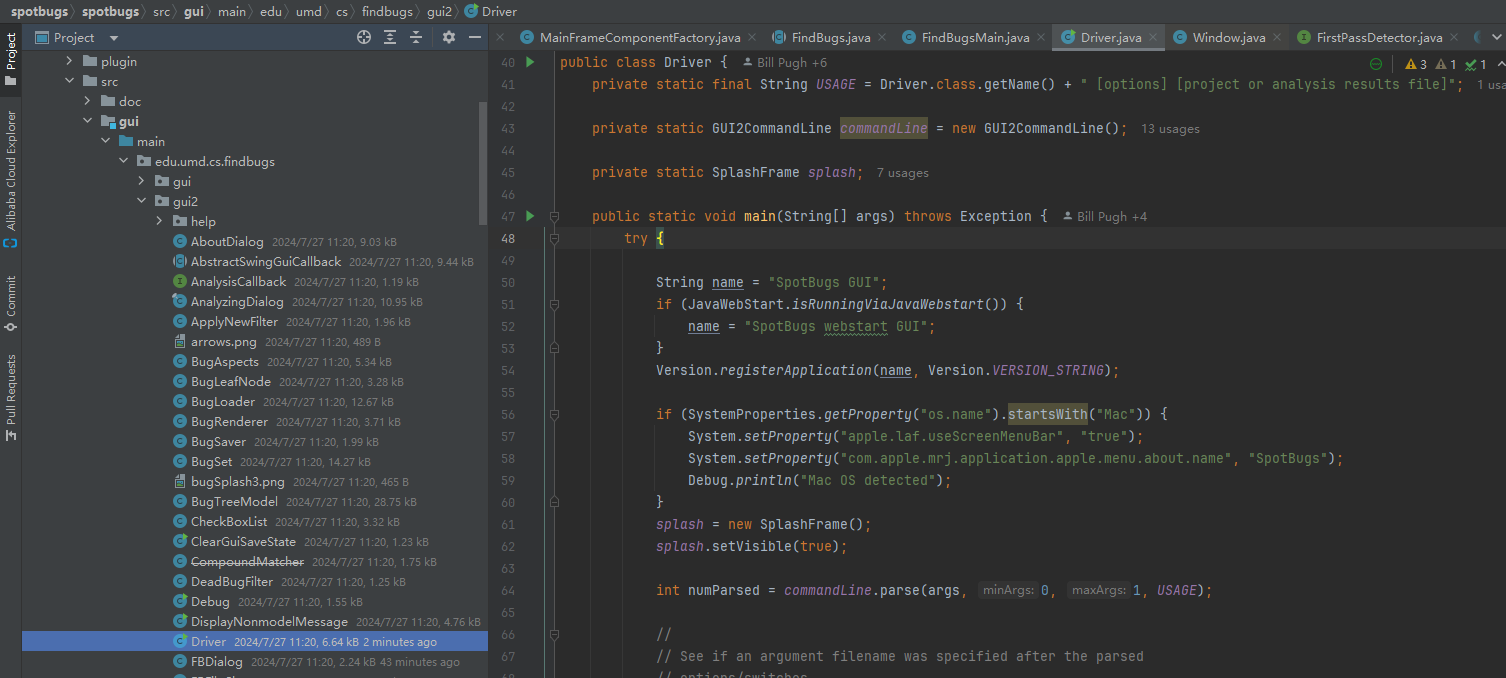
从源码上,我们可以看到,spotbugs 本身是自带一套 GUI 的,不过 swing 框架的样式有点丑,不易于与自动化构建工具,配合,一般用的不是很多。
gui文件夹是spotbugs swing框架GUI的源代码: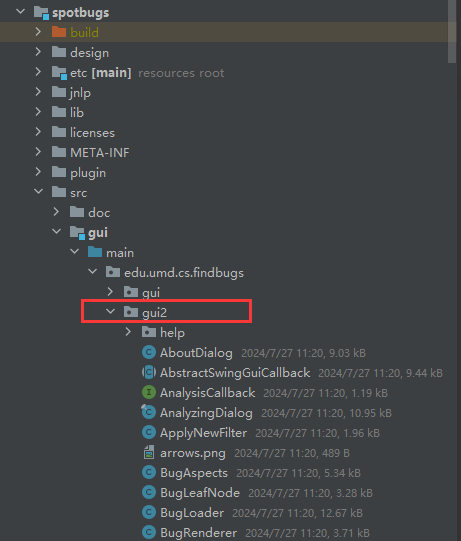
GUI 启动后,文件 > 新建 弹出对话框: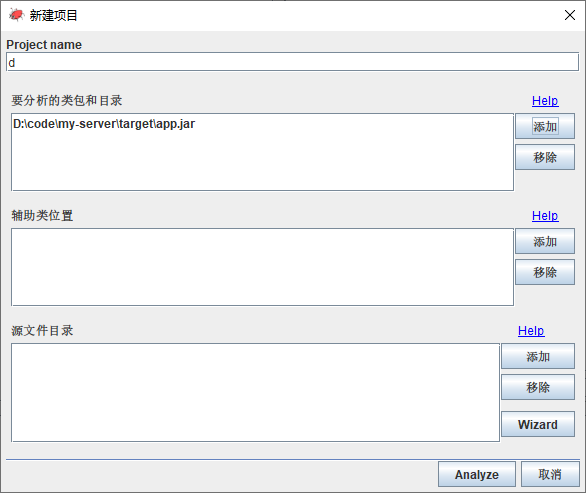
概念解析
在这里需要介绍一下的是,spotbugs 引擎工作单元是project。
project 包括分析文件(jar),辅助文件,源码文件文件夹。
AnalysisPass: 分析贯穿整个执行计划。AnalysisPass 是要分析的类的检测器集合,包括 orderedFactoryList ,memberSet
点击 Analyze 按钮后,执行 edu.umd.cs.findbugs.gui2.AnalyzingDialog.AnalysisThread#run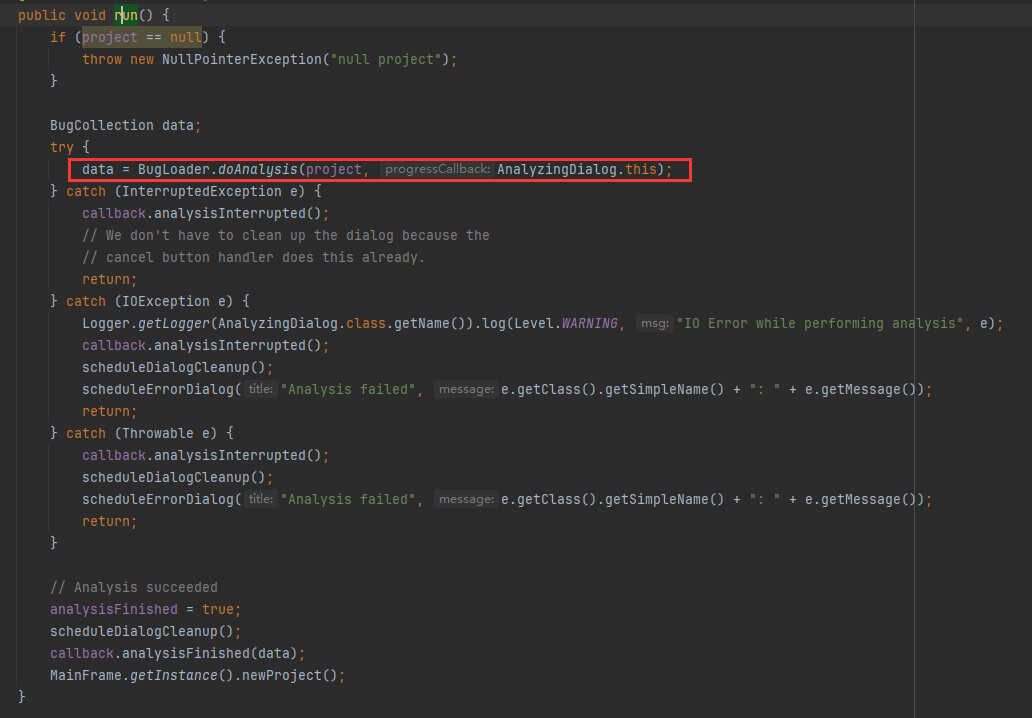
BugLoader 在这里是个很重要的类,它将GUI和分析引擎有机的结合了起来。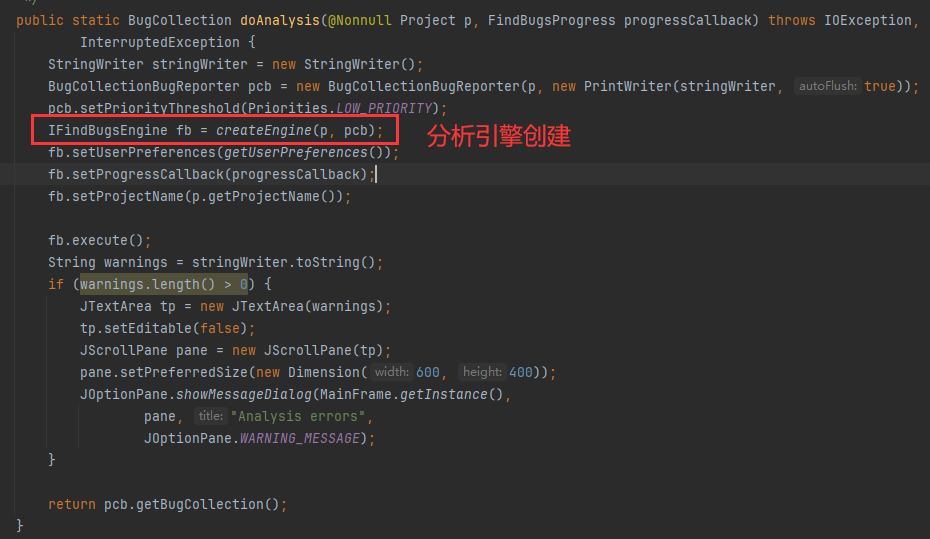
/** * Execute the analysis. For obscure reasons, CheckedAnalysisExceptions are * re-thrown as IOExceptions. However, these can only happen during the * setup phase where we scan codebases for classes. * * @throws IOException * @throws InterruptedException */ @Override public void execute() throws IOException, InterruptedException { if (FindBugs.isNoAnalysis()) { throw new UnsupportedOperationException("This FindBugs invocation was started without analysis capabilities"); } Profiler profiler = bugReporter.getProjectStats().getProfiler(); try { try { // 获取一个ClassFactory对象,用于创建类路径、代码库和其他相关对象。 classFactory = ClassFactory.instance(); // 创建一个类路径对象。 createClassPath(); // 报告项目文件数量和辅助类路径条目数量。 progressReporter.reportNumberOfArchives(project.getFileCount() + project.getNumAuxClasspathEntries()); //启动分析器。 profiler.start(this.getClass()); // 创建一个分析缓存对象 createAnalysisCache(); // 创建一个分析上下文对象,该对象用于处理项目、应用程序类列表和其他相关信息 createAnalysisContext(project, appClassList, analysisOptions.sourceInfoFileName); // 构建类路径,包括发现和枚举所有类路径上的代码库 buildClassPath(); // 构建应用程序类引用集合 buildReferencedClassSet(); // 设置应用程序类列表 setAppClassList(appClassList); // Configure the BugCollection (if we are generating one) FindBugs.configureBugCollection(this); // Enable/disabled relaxed reporting mode FindBugsAnalysisFeatures.setRelaxedMode(analysisOptions.relaxedReportingMode); FindBugsDisplayFeatures.setAbridgedMessages(analysisOptions.abridgedMessages); // Configure training databases FindBugs.configureTrainingDatabases(this); // Configure analysis features configureAnalysisFeatures(); // 创建执行计划 createExecutionPlan(); //遍历插件,并执行以下操作: //检查插件是否启用了默认的Bug报告装饰器。 //如果启用了,则将装饰器添加到bugReporter中。 p. 如果类筛选器不空,则创建一个委托BugReporter,该委托仅报告满足类筛选器条件的类。 q. 如果应用程序类列表为空,则根据analysisOptions中的设置处理情况:如果允许无类文件,则输出无警告的输出;如果不允许,则抛出一个IOException异常。 for (Plugin p : detectorFactoryCollection.plugins()) { for (ComponentPlugin<BugReporterDecorator> brp : p.getComponentPlugins(BugReporterDecorator.class)) { if (brp.isEnabledByDefault() && !brp.isNamed(explicitlyDisabledBugReporterDecorators) || brp.isNamed(explicitlyEnabledBugReporterDecorators)) { bugReporter = BugReporterDecorator.construct(brp, bugReporter); } } } if (!classScreener.vacuous()) { bugReporter = new DelegatingBugReporter(bugReporter) { @Override public void reportBug(@Nonnull BugInstance bugInstance) { String className = bugInstance.getPrimaryClass().getClassName(); String resourceName = ClassName.toSlashedClassName(className) + ".class"; if (classScreener.matches(resourceName)) { this.getDelegate().reportBug(bugInstance); } } }; } if (executionPlan.isActive(NoteSuppressedWarnings.class)) { SuppressionMatcher m = AnalysisContext.currentAnalysisContext().getSuppressionMatcher(); bugReporter = new FilterBugReporter(bugReporter, m, false); } if (appClassList.size() == 0) { Map<String, ICodeBaseEntry> codebase = classPath.getApplicationCodebaseEntries(); if (analysisOptions.noClassOk) { System.err.println("No classfiles specified; output will have no warnings"); } else if (codebase.isEmpty()) { throw new IOException("No files to analyze could be opened"); } else { throw new NoClassesFoundToAnalyzeException(classPath); } } // 分析应用程序。 analyzeApplication(); } catch (CheckedAnalysisException e) { …… } } 最为核心的部分,分析引擎启动,它主要用于以下几个步骤:
- 初始化一些变量,如passCount、profiler、badClasses等。 获取项目统计信息中的profiler对象。
- 启动分析过程,并预测分析次数。 遍历所有引用类,并实例化Detector2对象。
- 检查实例化过程中出现的异常,并将其添加到badClasses集合中。
- 根据是否为非报告的第一轮分析,决定是否将引用类集合(referencedClassSet)中的所有类添加到appClassList中。
- 按照调用图的顺序对应用程序类进行排序。 遍历appClassList中的每个类,并执行以下操作: a. 检查类是否符合类过滤器的要求。 b. 如果类过大,则报告一个错误。 c. 通知类观察者。 d. 开始分析当前类。 e. 应用所有Detector2对象到当前类。 f. 结束分析当前类。
- 调用每个Detector2对象的finishPass方法。
- 完成分析过程,并报告队列中的错误。
结束分析过程。
private void analyzeApplication() throws InterruptedException { int passCount = 0; Profiler profiler = bugReporter.getProjectStats().getProfiler(); profiler.start(this.getClass()); AnalysisContext.currentXFactory().canonicalizeAll(); try { boolean multiplePasses = executionPlan.getNumPasses() > 1; if (executionPlan.getNumPasses() == 0) { throw new AssertionError("no analysis passes"); } int[] classesPerPass = new int[executionPlan.getNumPasses()]; classesPerPass[0] = referencedClassSet.size(); for (int i = 0; i < classesPerPass.length; i++) { classesPerPass[i] = i == 0 ? referencedClassSet.size() : appClassList.size(); } progressReporter.predictPassCount(classesPerPass); XFactory factory = AnalysisContext.currentXFactory(); Collection<ClassDescriptor> badClasses = new LinkedList<>(); // 初始化类信息:方法、字段等 for (ClassDescriptor desc : referencedClassSet) { try { XClass info = Global.getAnalysisCache().getClassAnalysis(XClass.class, desc); factory.intern(info); } catch (CheckedAnalysisException e) { AnalysisContext.logError("Couldn't get class info for " + desc, e); badClasses.add(desc); } catch (RuntimeException e) { AnalysisContext.logError("Couldn't get class info for " + desc, e); badClasses.add(desc); } } if (!badClasses.isEmpty()) { referencedClassSet = new LinkedHashSet<>(referencedClassSet); referencedClassSet.removeAll(badClasses); } long startTime = System.currentTimeMillis(); bugReporter.getProjectStats().setReferencedClasses(referencedClassSet.size()); for (Iterator<AnalysisPass> passIterator = executionPlan.passIterator(); passIterator.hasNext();) { AnalysisPass pass = passIterator.next(); // The first pass is generally a non-reporting pass which // gathers information about referenced classes. boolean isNonReportingFirstPass = multiplePasses && passCount == 0; // Instantiate the detectors Detector2[] detectorList = pass.instantiateDetector2sInPass(bugReporter); // If there are multiple passes, then on the first pass, // we apply detectors to all classes referenced by the // application classes. // On subsequent passes, we apply detector only to application // classes. Collection<ClassDescriptor> classCollection = (isNonReportingFirstPass) ? referencedClassSet : appClassList; AnalysisContext.currentXFactory().canonicalizeAll(); if (PROGRESS || LIST_ORDER) { System.out.printf("%6d : Pass %d: %d classes%n", (System.currentTimeMillis() - startTime) / 1000, passCount, classCollection .size()); if (DEBUG) { XFactory.profile(); } } if (!isNonReportingFirstPass) { OutEdges<ClassDescriptor> outEdges = e -> { try { XClass classNameAndInfo = Global.getAnalysisCache().getClassAnalysis(XClass.class, e); return classNameAndInfo.getCalledClassDescriptors(); } catch (CheckedAnalysisException e2) { AnalysisContext.logError("error while analyzing " + e.getClassName(), e2); return Collections.emptyList(); } }; classCollection = sortByCallGraph(classCollection, outEdges); } if (LIST_ORDER) { System.out.println("Analysis order:"); for (ClassDescriptor c : classCollection) { System.out.println(" " + c); } } AnalysisContext currentAnalysisContext = AnalysisContext.currentAnalysisContext(); currentAnalysisContext.updateDatabases(passCount); progressReporter.startAnalysis(classCollection.size()); int count = 0; Global.getAnalysisCache().purgeAllMethodAnalysis(); Global.getAnalysisCache().purgeClassAnalysis(FBClassReader.class); for (ClassDescriptor classDescriptor : classCollection) { long classStartNanoTime = 0; if (PROGRESS) { classStartNanoTime = System.nanoTime(); System.out.printf("%6d %d/%d %d/%d %s%n", (System.currentTimeMillis() - startTime) / 1000, passCount, executionPlan.getNumPasses(), count, classCollection.size(), classDescriptor); } count++; // Check to see if class is excluded by the class screener. // In general, we do not want to screen classes from the // first pass, even if they would otherwise be excluded. if ((SCREEN_FIRST_PASS_CLASSES || !isNonReportingFirstPass) && !classScreener.matches(classDescriptor.toResourceName())) { if (DEBUG) { System.out.println("*** Excluded by class screener"); } continue; } boolean isHuge = currentAnalysisContext.isTooBig(classDescriptor); if (isHuge && currentAnalysisContext.isApplicationClass(classDescriptor)) { bugReporter.reportBug(new BugInstance("SKIPPED_CLASS_TOO_BIG", Priorities.NORMAL_PRIORITY) .addClass(classDescriptor)); } currentClassName = ClassName.toDottedClassName(classDescriptor.getClassName()); notifyClassObservers(classDescriptor); profiler.startContext(currentClassName); currentAnalysisContext.setClassBeingAnalyzed(classDescriptor); try { Collection<Callable<Void>> tasks = Arrays.stream(detectorList).map(detector -> (Callable<Void>) () -> { if (Thread.interrupted()) { throw new InterruptedException(); } if (isHuge && !FirstPassDetector.class.isAssignableFrom(detector.getClass())) { return null; } LOG.debug("Applying {} to {}", detector.getDetectorClassName(), classDescriptor); try { profiler.start(detector.getClass()); detector.visitClass(classDescriptor); } catch (MissingClassException e) { Global.getAnalysisCache().getErrorLogger().reportMissingClass(e.getClassDescriptor()); } catch (CheckedAnalysisException | RuntimeException e) { logRecoverableException(classDescriptor, detector, e); } finally { profiler.end(detector.getClass()); } return null; }).collect(Collectors.toList()); service.invokeAll(tasks).forEach(future -> { try { future.get(); } catch (InterruptedException e) { LOG.warn("Thread interrupted during analysis", e); Thread.currentThread().interrupt(); } catch (ExecutionException e) { throw new AnalysisException("Exeption was thrown during analysis", e); } }); if (Thread.interrupted()) { throw new InterruptedException(); } } finally { progressReporter.finishClass(); profiler.endContext(currentClassName); currentAnalysisContext.clearClassBeingAnalyzed(); if (PROGRESS) { long usecs = (System.nanoTime() - classStartNanoTime) / 1000; if (usecs > 15000) { int classSize = currentAnalysisContext.getClassSize(classDescriptor); long speed = usecs / classSize; if (speed > 15) { System.out.printf(" %6d usecs/byte %6d msec %6d bytes %d pass %s%n", speed, usecs / 1000, classSize, passCount, classDescriptor); } } } } } // Call finishPass on each detector for (Detector2 detector : detectorList) { detector.finishPass(); } progressReporter.finishPerClassAnalysis(); passCount++; } } finally { bugReporter.finish(); bugReporter.reportQueuedErrors(); profiler.end(this.getClass()); if (PROGRESS) { System.out.println("Analysis completed"); } } } 熟悉设计模式的同学,在 detector.visitClass(classDescriptor); 这行代码就能看到,spotbugs 使用了访问者模式,使执行与数据相分离,能有效地解耦。
detector 有2类,一类是Detector2 一类是Detector。并通过适配器实现了统一。
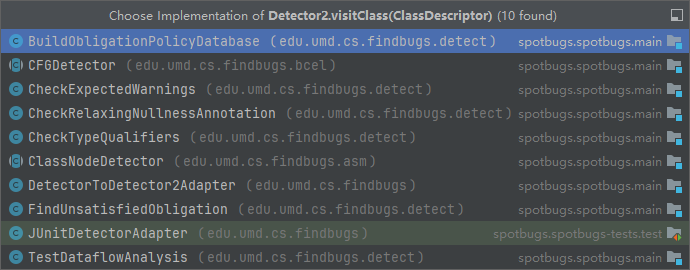
Detector 有如下实现: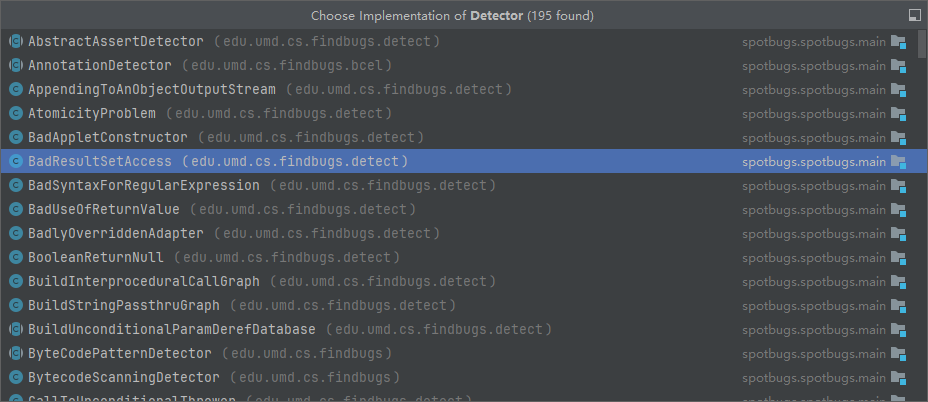
而在运行中,会有DetectorToDetectorAdaptor 类的存在,如下图: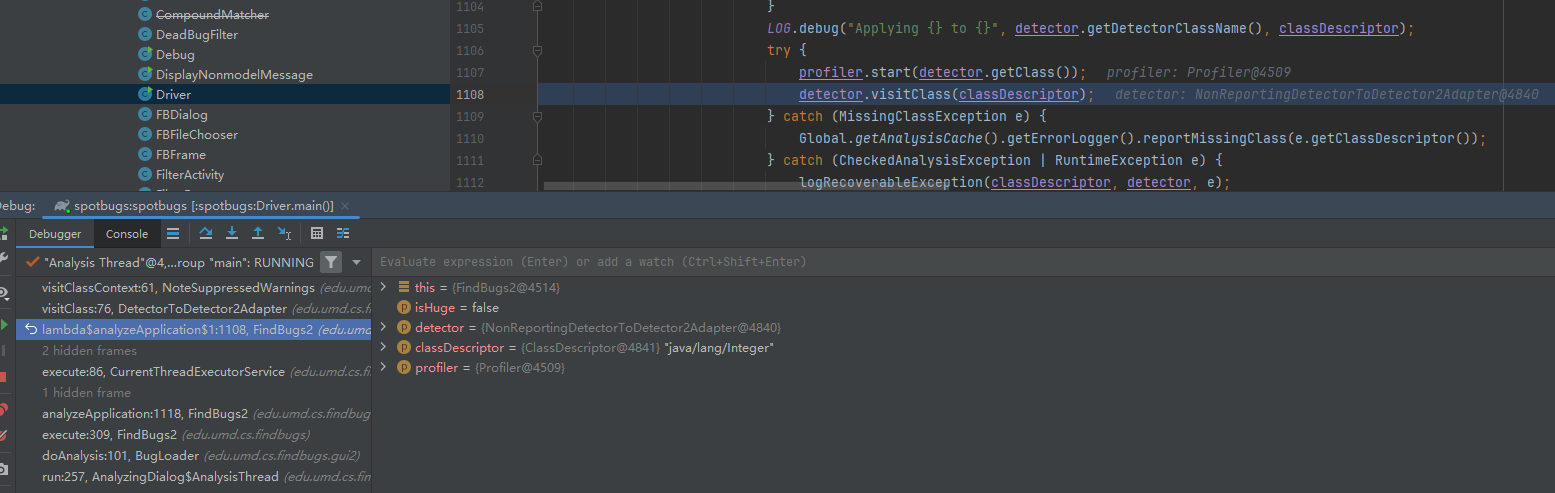
比较有意思的是,它是实现了Detector2 接口,接收 Detector 参数,并在 visitClass 方法中调用其方法,是个很经典的适配器模式的使用: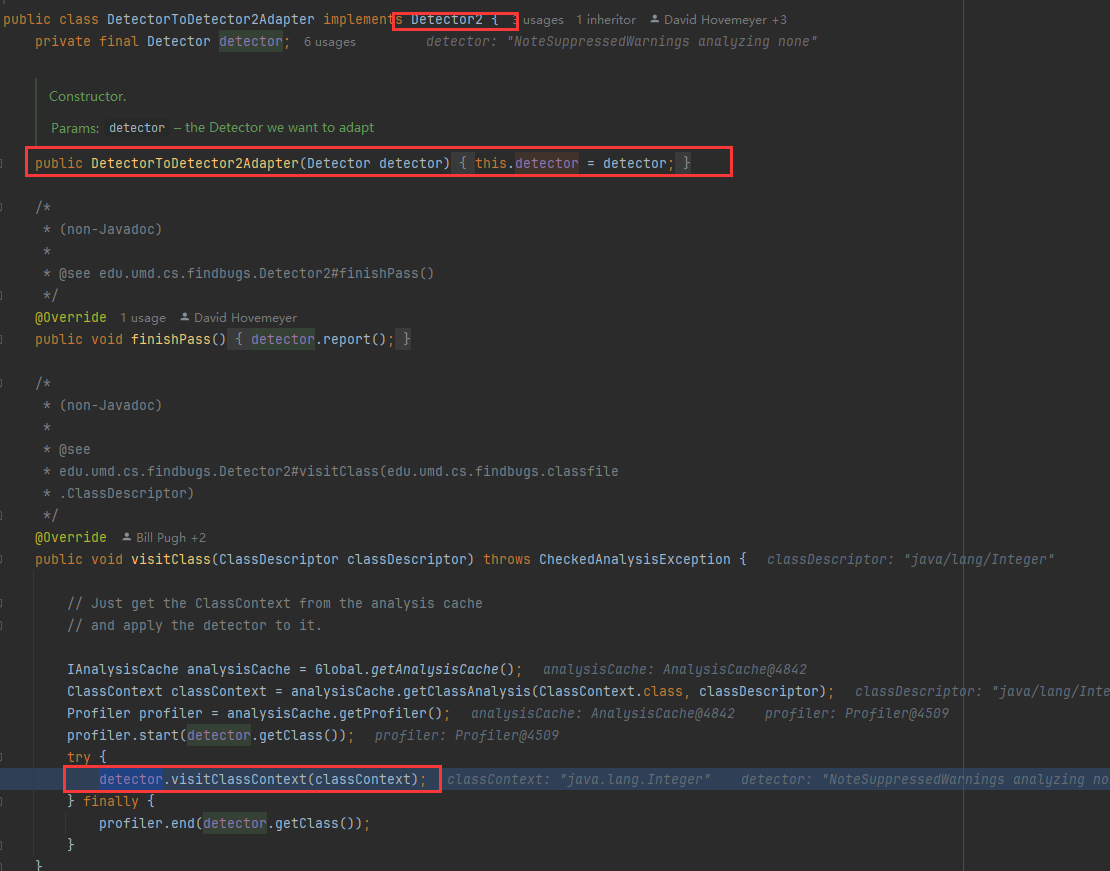
综上所述,SpotBugs的架构设计体现了高效性、可扩展性和易用性的原则。通过核心的分析引擎、丰富的规则集、灵活的用户界面和集成方式以及性能优化措施,SpotBugs为Java开发人员提供了一个强大的静态分析工具,帮助他们编写更高质量的代码。
