习题编号目录
练习题主要就是 写代码,所以这篇文章大部分是代码哟~
No 1
- What are 3 areas in industry where computer vision is currently being used?
No 2
工业异常检测,目标检测
- Search “what is overfitting in machine learning” and write down a sentence about what you find.
“overfitting”,就是过拟合,学的特征太多了,太细节了。
举个例子:
一个模型需要学习树叶,来分辨这个图片是不是树叶,但我们的数据比较有特点,是锯齿状的树叶,模型学到了锯齿状,于是就判定圆形的树叶不是树叶啦,这就是过拟合。
很明显过拟合会影响模型的泛化性能。
No 3
- Search “ways to prevent overfitting in machine learning”, write down 3 of the things you find and a sentence about each. Note: there are lots of these, so don’t worry too much about all of them, just pick 3 and start with those.
-
数据集扩充:通过增加训练数据集的样本数量来减少模型对训练数据的过度拟合,从而提高模型的泛化性能。eg:生成一些类似但不完全相同的样本来扩充训练集。这些类似但不完全相同的样本可以通过对原始数据集进行一些变换操作得到,比如图像数据可以进行翻转、旋转、缩放等操作。
-
正则化:可以通过在模型的损失函数中加入一项正则化项,对模型进行约束,使其在学习过程中对训练数据的拟合程度受到一定程度的限制。正则化的思想是通过对模型的参数进行惩罚,使得模型的权重变得更小,从而降低模型的复杂度,提高泛化能力。
-
数据降维:将高维数据映射到低维空间,可以减少特征之间的冗余信息,从而提高模型的泛化能力。有两种方法:特征选择和特征提取。特征选择是指从原始特征中选择最相关的特征,从而达到降低数据维度的目的。而特征提取则是通过某种算法将原始特征转化为新的特征,从而达到降低数据维度的目的。
No 4
- Spend 20-minutes reading and clicking through the CNN Explainer website.
* Upload your own example image using the “upload” button and see what happens in each layer of a CNN as your image passes through it.
No 5
- Load the
torchvision.datasets.MNIST()train and test datasets.
import torchvision import torchvision.datasets as datasets from torchvision.transforms import ToTensor train_data = datasets.MNIST(root='data', train=True, download=True, transform=ToTensor(), target_transform=None) test_data = datasets.MNIST(root='data', train=False, download=True, transform=ToTensor(), target_transform=None) No 6
- Visualize at least 5 different samples of the MNIST training dataset.
image, label = train_data[0] image, label (tensor([[[0.0000, 0.0000, 0.0000, 0.0000, 0.0000, 0.0000, 0.0000, 0.0000,
0.0000, 0.0000, 0.0000, 0.0000, 0.0000, 0.0000, 0.0000, 0.0000,
0.0000, 0.0000, 0.0000, 0.0000, 0.0000, 0.0000, 0.0000, 0.0000,
0.0000, 0.0000, 0.0000, 0.0000],
[0.0000, 0.0000, 0.0000, 0.0000, 0.0000, 0.0000, 0.0000, 0.0000,
0.0000, 0.0000, 0.0000, 0.0000, 0.0118, 0.0706, 0.0706, 0.0706,
0.4941, 0.5333, 0.6863, 0.1020, 0.6510, 1.0000, 0.9686, 0.4980,
0.0000, 0.0000, 0.0000, 0.0000],
[0.0000, 0.0000, 0.0000, 0.0000, 0.0000, 0.0000, 0.0000, 0.0000,
…
[0.0000, 0.0000, 0.0000, 0.0000, 0.0000, 0.0000, 0.0000, 0.0000,
0.0000, 0.0000, 0.0000, 0.0000, 0.0000, 0.0000, 0.0000, 0.0000,
0.0000, 0.0000, 0.0000, 0.0000, 0.0000, 0.0000, 0.0000, 0.0000,
0.0000, 0.0000, 0.0000, 0.0000]]]),
5)
Output is truncated. View as a scrollable element or open in a text editor. Adjust cell output settings…
class_names = train_data.classes class_names [‘0 - zero’,
‘1 - one’,
‘2 - two’,
‘3 - three’,
‘4 - four’,
‘5 - five’,
‘6 - six’,
‘7 - seven’,
‘8 - eight’,
‘9 - nine’]
train_data Dataset MNIST
Number of datapoints: 60000
Root location: data
Split: Train
StandardTransform
Transform: ToTensor()
import matplotlib.pyplot as plt image, label = train_data[0] plt.imshow(image.squeeze(), cmap="gray") plt.title(class_names[label]) 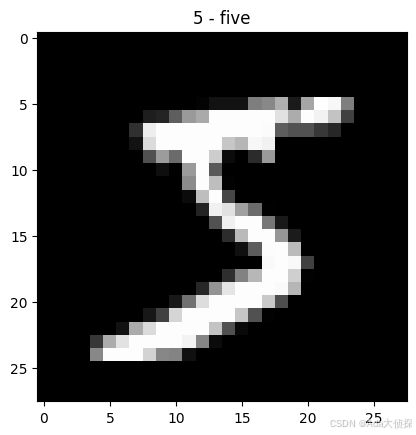
import random train_samples = [] train_labels = [] for sample, label in random.sample(list(train_data), k=5): train_samples.append(sample) train_labels.append(label) train_samples[0].shape torch.Size([1, 28, 28])
import torch import matplotlib.pyplot as plt torch.manual_seed(42) plt.figure(figsize=(10, 5)) nrows = 1 ncols = 5 for i, sample in enumerate(train_samples): plt.subplot(nrows, ncols, i+1) plt.imshow(sample.squeeze(), cmap="gray") plt.axis(False) # plt.title(class_names[train_label]) 
No 7
- Turn the MNIST train and test datasets into dataloaders using
torch.utils.data.DataLoader, set thebatch_size=32.
from torch.utils.data import DataLoader BATCH_SIZE=32 train_dataloader = DataLoader(dataset=train_data, shuffle=True, batch_size=BATCH_SIZE) test_dataloader = DataLoader(dataset=test_data, batch_size=BATCH_SIZE, shuffle=False) train_dataloader, test_dataloader (<torch.utils.data.dataloader.DataLoader at 0x1f4d79a95e0>,
<torch.utils.data.dataloader.DataLoader at 0x1f4df3b0e50>)
No 8
- Recreate
model_2used in this notebook (the same model from the CNN Explainer website, also known as TinyVGG) capable of fitting on the MNIST dataset.
# 设备无关代码 device = "cuda" if torch.cuda.is_available() else "cpu" device ‘cuda’
创建模型
import torch.nn as nn # 创建 CNN 模型 class MNISTModelV0(nn.Module): def __init__(self, input_shape:int, hidden_units:int, output_shape:int): super().__init__() self.conv_block_1 = nn.Sequential( nn.Conv2d(in_channels=input_shape, out_channels=hidden_units, kernel_size=(3, 3), stride=1, padding=1), nn.ReLU(), nn.Conv2d(in_channels=hidden_units, out_channels=hidden_units, kernel_size=(3, 3), stride=1, padding=1), nn.ReLU(), nn.MaxPool2d(kernel_size=(2, 2)) ) self.conv_block_2 = nn.Sequential( nn.Conv2d(in_channels=hidden_units, out_channels=hidden_units, kernel_size=(3, 3), stride=1, padding=1), nn.ReLU(), nn.Conv2d(in_channels=hidden_units, out_channels=hidden_units, kernel_size=(3, 3), stride=1, padding=1), nn.ReLU(), nn.MaxPool2d(kernel_size=(2, 2)) ) self.classifier = nn.Sequential( nn.Flatten(), nn.Linear(in_features=hidden_units*7*7, out_features=output_shape) ) def forward(self, x): x = self.conv_block_1(x) # print(f"Output shape of conv_block_1:{x.shape}") x = self.conv_block_2(x) # print(f"Output shape of conv_block_2:{x.shape}") x = self.classifier(x) # print(f"Output shape of classifier:{x.shape}") return x # 实例化模型 model_0 = MNISTModelV0(input_shape=1, hidden_units=10, output_shape=len(class_names)) model_0.to(device) MNISTModelV0(
(conv_block_1): Sequential(
(0): Conv2d(1, 10, kernel_size=(3, 3), stride=(1, 1), padding=(1, 1))
(1): ReLU()
(2): Conv2d(10, 10, kernel_size=(3, 3), stride=(1, 1), padding=(1, 1))
(3): ReLU()
(4): MaxPool2d(kernel_size=(2, 2), stride=(2, 2), padding=0, dilation=1, ceil_mode=False)
)
(conv_block_2): Sequential(
(0): Conv2d(10, 10, kernel_size=(3, 3), stride=(1, 1), padding=(1, 1))
(1): ReLU()
(2): Conv2d(10, 10, kernel_size=(3, 3), stride=(1, 1), padding=(1, 1))
(3): ReLU()
(4): MaxPool2d(kernel_size=(2, 2), stride=(2, 2), padding=0, dilation=1, ceil_mode=False)
)
(classifier): Sequential(
(0): Flatten(start_dim=1, end_dim=-1)
(1): Linear(in_features=490, out_features=10, bias=True)
)
)
先搞个测试数据传一下,后面报错了,我们来找找是什么原因这个方法真的好用!!!
random_image_tensor = torch.randn(size=(1, 28, 28)) random_image_tensor.shape torch.Size([1, 28, 28])
# 把这个测试数据传递给模型看看会不会报错 model_0.to(device) model_0(random_image_tensor.unsqueeze(0).to(device)) tensor([[ 0.0366, -0.0940, 0.0686, -0.0485, 0.0068, 0.0290, 0.0132, 0.0084,
-0.0030, -0.0185]], device=‘cuda:0’, grad_fn=< AddmmBackward0>)
通过print方法,知道是模型中传递给网络的输入输出有问题
No 9
- Train the model you built in exercise 8. on CPU and GPU and see how long it takes on each.
image, label = train_data[0] image.shape torch.Size([1, 28, 28])
BB,这些函数都是我们之前学习过的喔喔喔
# 损失函数和优化器 import torch.optim as optim loss_fn = nn.CrossEntropyLoss() optimizer = optim.SGD(params=model_0.parameters(), lr=0.1) # 训练函数 def train_step(model:nn.Module, dataloader:DataLoader, loss_fn:nn.Module, optimizer:torch.optim.Optimizer, accuracy_fn, device:torch.device = device): # 设置循环周期 train_loss, train_acc = 0, 0 model.train() for batch, (X, y) in enumerate(dataloader): # 将数据放到统一的设备上 X, y = X.to(device), y.to(device) y_pred = model(X) loss = loss_fn(y_pred, y) train_loss += loss train_acc += accuracy_fn(y_true=y, y_pred=y_pred.argmax(dim=1)) optimizer.zero_grad() loss.backward() optimizer.step() train_loss /= len(dataloader) train_acc /= len(dataloader) print(f"Train Loss:{train_loss:.4f} | Train Acc:{train_acc:.2f}%") # 测试函数 def test_step(model:nn.Module, dataloader:DataLoader, loss_fn:nn.Module, accuracy_fn, device:torch.device=device): """Peroforms a testing loop step on model going over data_loader""" test_loss, test_acc = 0, 0 model.eval() with torch.inference_mode(): for X, y in dataloader: X, y = X.to(device), y.to(device) y_pred = model(X) test_loss += loss_fn(y_pred, y) test_acc += accuracy_fn(y_true=y, y_pred=y_pred.argmax(dim=1)) test_loss /= len(dataloader) test_acc /= len(dataloader) print(f"Test Loss:{test_loss:.4f} | Test Acc:{test_acc:.2f}%\n") # 评估函数 def eval_model(model:nn.Module, dataloader:DataLoader, loss_fn:nn.Module, accuracy_fn, device=device): """Returns a dictionary containing the results of model predicting on data_loader...""" loss, acc = 0, 0 model.eval() with torch.inference_mode(): for X, y in dataloader: X, y = X.to(device), y.to(device) y_pred = model(X) loss += loss_fn(y_pred, y) acc += accuracy_fn(y_true=y, y_pred=y_pred.argmax(dim=1)) loss /= len(dataloader) acc /= len(dataloader) return {"model_name":model.__class__.__name__, "model_loss":loss.item(), "model_acc":acc} from timeit import default_timer as timer def print_train_time(start:float, end:float, device:torch.device=None): """Prints difference between start and end time.""" total_time = end - start print(f"Train time on {device}:{total_time:.3f} seconds") return total_time # Calculate accuracy (a classification metric) def accuracy_fn(y_true, y_pred): """Calculates accuracy between truth labels and predictions. Args: y_true (torch.Tensor): Truth labels for predictions. y_pred (torch.Tensor): Predictions to be compared to predictions. Returns: [torch.float]: Accuracy value between y_true and y_pred, e.g. 78.45 """ correct = torch.eq(y_true, y_pred).sum().item() acc = (correct / len(y_pred)) * 100 return acc 训练模型
from tqdm.auto import tqdm from helper_functions import accuracy_fn # train and test on GPU train_start_time_on_gpu = timer() epochs=3 for epoch in tqdm(range(epochs)): print(f"Epoch:{epoch}\n") train_step(model=model_0, dataloader=train_dataloader, loss_fn=loss_fn, optimizer=optimizer, accuracy_fn=accuracy_fn, device=device) test_step(model=model_0, dataloader=test_dataloader, loss_fn=loss_fn, accuracy_fn=accuracy_fn, device=device) train_end_time_on_gpu = timer() total_time_on_gpu = print_train_time(start=train_start_time_on_gpu, end=train_end_time_on_gpu, device=device) 
我简直了,我都不敢信,这准确率是多少!
来,Ada,张开你的卡姿兰大眼睛看看这个数字,到底是多少
啊啊啊啊啊,98%啊,天哪噜,98%,震惊!
喔霍霍,妈呀,好好好
model_0_result = eval_model(model=model_0, dataloader=test_dataloader, loss_fn=loss_fn, accuracy_fn=accuracy_fn, device=device) model_0_result {‘model_name’: ‘MNISTModelV0’,
‘model_loss’: 0.05393431708216667,
‘model_acc’: 98.10303514376997}
No 10
- Make predictions using your trained model and visualize at least 5 of them comparing the prediciton to the target label.
def make_prediction(model:nn.Module, data: list, device:torch.device=device): pred_probs=[] model.to(device) model.eval() with torch.inference_mode(): for sample in data: sample = torch.unsqueeze(sample, dim=0).to(device) pred_logit = model(sample) pred_prob = torch.softmax(pred_logit.squeeze(),dim=0) pred_probs.append(pred_prob.cpu()) # Stack the pred_probs to turn list into a tensor return torch.stack(pred_probs) import random test_samples = [] test_labels = [] for sample, label in random.sample(list(test_data),k=9): test_samples.append(sample) test_labels.append(label) # make predictions pred_probs = make_prediction(model=model_0, data=test_samples, device=device) pred_probs tensor([[1.0177e-07, 9.6744e-08, 9.0552e-05, 4.1145e-07, 3.1134e-09, 9.2933e-08,
1.0455e-07, 8.3808e-07, 9.9990e-01, 1.0561e-05],
[7.0788e-10, 1.9963e-08, 1.1445e-07, 7.4835e-07, 1.0650e-04, 1.4251e-06,
2.5626e-12, 5.2849e-06, 8.3278e-06, 9.9988e-01],
[2.0574e-11, 2.7979e-05, 9.9959e-01, 3.6853e-04, 1.0323e-13, 1.5242e-13,
1.8023e-12, 9.5447e-06, 5.1182e-07, 4.4869e-12],
[2.2204e-10, 6.1201e-10, 4.8230e-05, 1.4246e-06, 3.8657e-12, 6.7251e-07,
9.1211e-10, 1.9719e-08, 9.9995e-01, 4.0643e-07],
[2.1181e-15, 8.9004e-13, 4.7079e-13, 3.2457e-08, 5.5606e-11, 1.0000e+00,
9.1563e-09, 4.4056e-17, 3.3977e-08, 3.1905e-08],
[1.4000e-05, 5.6517e-10, 1.0992e-05, 4.6077e-11, 9.9994e-01, 5.4655e-09,
4.8744e-06, 8.1010e-06, 7.0937e-08, 2.0188e-05],
[9.9992e-01, 6.8991e-11, 7.1014e-05, 6.2839e-11, 3.7751e-11, 2.0786e-07,
7.2334e-07, 9.5343e-10, 4.6806e-06, 7.3413e-08],
[7.6309e-13, 3.0353e-10, 7.0295e-10, 4.9777e-07, 2.5954e-14, 8.0768e-12,
9.5778e-17, 1.0000e+00, 1.0831e-10, 1.9796e-08],
[1.4944e-11, 7.4691e-13, 2.8261e-12, 6.1482e-08, 1.7732e-11, 1.0000e+00,
4.6807e-09, 2.5018e-11, 1.3533e-07, 2.7457e-06]])
pred_classes = pred_probs.argmax(dim=1) pred_classes tensor([8, 9, 2, 8, 5, 4, 0, 7, 5])
# plot predictions plt.figure(figsize=(9,9)) nrows = 3 ncols = 3 for i, sample in enumerate(test_samples): plt.subplot(nrows, ncols, i+1) plt.imshow(sample.squeeze(), cmap="gray") pred_label = class_names[pred_classes[i]] truth_label = class_names[test_labels[i]] title_text = f"Pred:{pred_label} | Truth:{truth_label}" # 预测正确是绿色的title, 预测错误是红色的title if pred_label == truth_label: plt.title(title_text, fontsize=10, c="g") else: plt.title(title_text, fontsize=10, c="r") plt.axis(False); 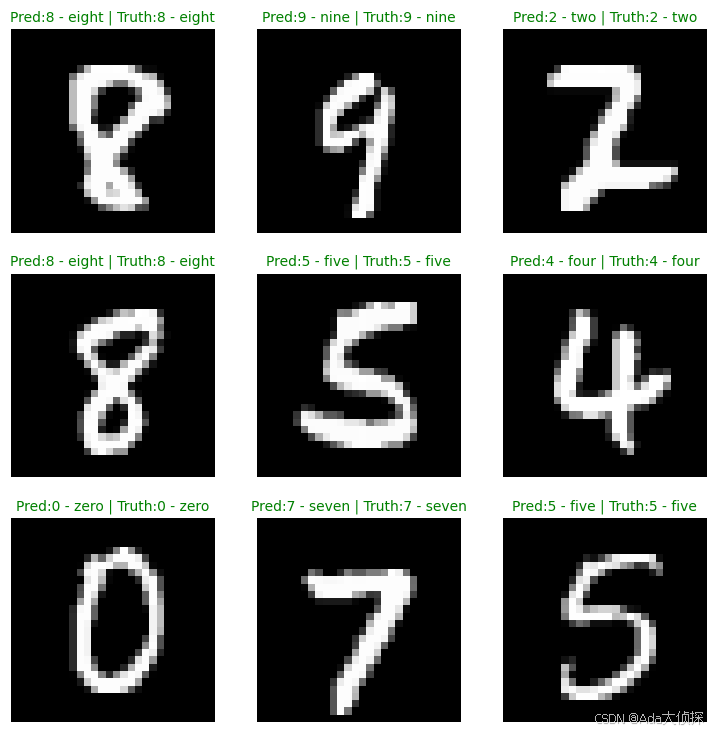
No 11
- Plot a confusion matrix comparing your model’s predictions to the truth labels.
from tqdm.auto import tqdm # 1 在测试数据上使用我们训练好的模型 y_preds = [] model_0.eval() with torch.inference_mode(): for X, y in test_dataloader: X, y = X.to(device), y.to(device) y_logit = model_0(X) y_pred = torch.softmax(y_logit.squeeze(), dim=0).argmax(dim=1) y_preds.append(y_pred.cpu()) # Concatenate list of predictions into a tensor y_pred_tensor = torch.cat(y_preds) y_pred_tensor tensor([7, 2, 1, …, 4, 5, 6])
from torchmetrics import ConfusionMatrix from mlxtend.plotting import plot_confusion_matrix # 2 制作confusion实例,将预测和标签进行比较 confmat = ConfusionMatrix(num_classes=len(class_names), task='multiclass') confmat_tensor = confmat(preds = y_pred_tensor, target = test_data.targets) # 3 plot the confusion matrix fig, ax = plot_confusion_matrix( conf_mat=confmat_tensor.numpy(), # matplotlib likes working with numpy class_names = class_names, figsize=(10, 7) ) 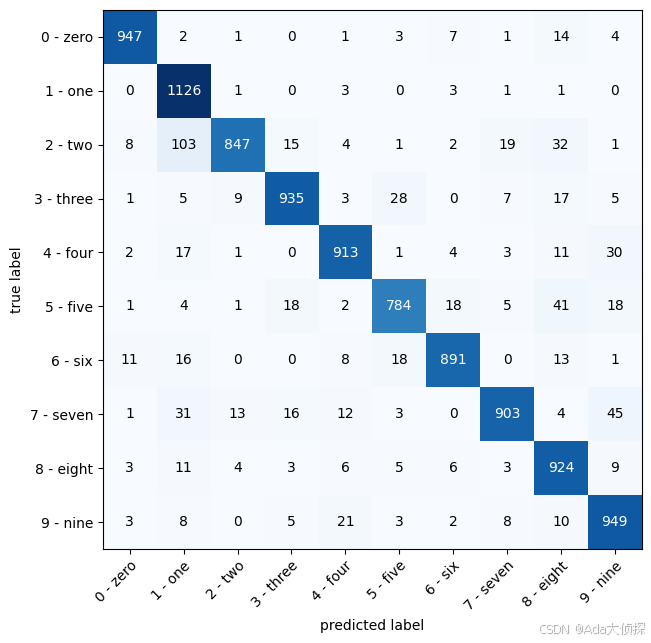
No 12
- Create a random tensor of shape
[1, 3, 64, 64]and pass it through ann.Conv2d()layer with various hyperparameter settings (these can be any settings you choose), what do you notice if thekernel_sizeparameter goes up and down?
import random random_tensor = torch.randn(size=(1, 3, 64, 64)) random_tensor tensor([[[[-0.6684, 0.4637, -0.3516, …, -0.6252, 0.6887, 0.2075],
[-1.1143, -1.2353, 0.3464, …, -0.7403, 0.3211, 0.2074],
[-0.1284, -1.0946, 0.4482, …, 0.7574, -0.2992, -0.0710],
…,
[ 1.5077, 0.2374, 0.2925, …, -0.2159, -0.6532, -1.2062],
[ 1.9584, 0.8458, 0.3636, …, 0.3946, 0.1667, -1.6578],
[ 1.1362, 1.9202, 1.0445, …, -0.4046, 0.9407, -0.3916]],
[-0.8766, -0.2172, 0.5522, …, -0.0553, -0.6218, 0.3710],
…,
[ 1.8482, -0.2374, 1.4276, …, -0.2379, 0.7371, -1.8488],
[-0.6760, 1.0012, -0.3990, …, -1.4388, -2.0143, -0.9468],
[-0.7640, 0.7572, 0.8566, …, -0.8063, -1.2623, -0.0394]]]])
conv_layer = nn.Conv2d(in_channels=3, out_channels=2, kernel_size=(3, 3), stride=1, padding=1) # 将随机生成的数据放到 conv_layer 中 random_tensor_through_conv = conv_layer(random_tensor) random_tensor_through_conv.shape torch.Size([1, 2, 64, 64])
conv_layer = nn.Conv2d(in_channels=3, out_channels=2, kernel_size=(5,5), stride=1, padding=1) # 将随机生成的数据放到 conv_layer 中 random_tensor_through_conv = conv_layer(random_tensor) random_tensor_through_conv.shape torch.Size([1, 2, 62, 62])
conv_layer = nn.Conv2d(in_channels=3, out_channels=2, kernel_size=(10, 10), stride=1, padding=1) # 将随机生成的数据放到 conv_layer 中 random_tensor_through_conv = conv_layer(random_tensor) random_tensor_through_conv.shape torch.Size([1, 2, 57, 57])
conv_layer = nn.Conv2d(in_channels=3, out_channels=2, kernel_size=(30, 30), stride=1, padding=1) # 将随机生成的数据放到 conv_layer 中 random_tensor_through_conv = conv_layer(random_tensor) random_tensor_through_conv.shape torch.Size([1, 2, 37, 37])
conv_layer = nn.Conv2d(in_channels=3, out_channels=2, kernel_size=(64, 64), stride=1, padding=1) # 将随机生成的数据放到 conv_layer 中 random_tensor_through_conv = conv_layer(random_tensor) random_tensor_through_conv.shape torch.Size([1, 2, 3, 3])
conv_layer = nn.Conv2d(in_channels=3, out_channels=2, kernel_size=(65, 65), stride=1, padding=1) # 将随机生成的数据放到 conv_layer 中 random_tensor_through_conv = conv_layer(random_tensor) random_tensor_through_conv.shape torch.Size([1, 2, 2, 2])
conv_layer = nn.Conv2d(in_channels=3, out_channels=2, kernel_size=(66, 66), stride=1, padding=1) # 将随机生成的数据放到 conv_layer 中 random_tensor_through_conv = conv_layer(random_tensor) random_tensor_through_conv.shape torch.Size([1, 2, 1, 1])
卷积核的大小,padding,stride都影响降低维度的量,比如我的padding是1,那我的kernel_size就可以达到66,而不是刚开始的64,就可以将维度降为1
No 13
- Use a model similar to the trained
model_2from this notebook to make predictions on the testtorchvision.datasets.FashionMNISTdataset.
* Then plot some predictions where the model was wrong alongside what the label of the image should’ve been.
* After visualing these predictions do you think it’s more of a modelling error or a data error?
* As in, could the model do better or are the labels of the data too close to each other (e.g. a “Shirt” label is too close to “T-shirt/top”)?
fashion_train_data = datasets.FashionMNIST(root='data', train=True, transform=ToTensor(), download=True, target_transform=None) fashion_test_data = datasets.FashionMNIST(root='data', train=False, download=True, transform=ToTensor(), target_transform=None) fashion_train_data,fashion_test_data (Dataset FashionMNIST
Number of datapoints: 60000
Root location: data
Split: Train
StandardTransform
Transform: ToTensor(),
Dataset FashionMNIST
Number of datapoints: 10000
Root location: data
Split: Test
StandardTransform
Transform: ToTensor())
fashion_train_dataloader = DataLoader(dataset=fashion_train_data, batch_size=BATCH_SIZE, shuffle=True) fashion_test_dataloader = DataLoader(dataset=fashion_test_data, batch_size=BATCH_SIZE, shuffle=True) len(fashion_train_dataloader),len(fashion_test_dataloader)
使用我们创建的模型来训练一下这个FashionMNIST数据集
train_start_time_on_fashion = timer() epochs = 3 for epoch in tqdm(range(epochs)): print(f"Epoch:{epoch}\n======================") train_step(model=model_0, dataloader=fashion_train_dataloader, loss_fn=loss_fn, optimizer=optimizer, device=device, accuracy_fn=accuracy_fn) test_step(model=model_0, dataloader=fashion_test_dataloader, loss_fn=loss_fn, accuracy_fn=accuracy_fn, device=device) train_end_time_on_fashion = timer() total_time_on_fashion = print_train_time(start=train_start_time_on_fashion, end=train_end_time_on_fashion, device=device) 
model_0_result_fashion = eval_model(model=model_0, dataloader=fashion_test_dataloader, loss_fn=loss_fn, accuracy_fn=accuracy_fn, device=device) model_0_result_fashion {‘model_name’: ‘MNISTModelV0’,
‘model_loss’: 0.31344807147979736,
‘model_acc’: 89.12739616613419}
model_0_result {‘model_name’: ‘MNISTModelV0’,
‘model_loss’: 0.05393431708216667,
‘model_acc’: 98.10303514376997}
import pandas as pd compare_results = pd.DataFrame([model_0_result, model_0_result_fashion]) compare_results 
compare_results["training_time"] = [total_time_on_gpu, total_time_on_fashion] compare_results 
compare_results["dataset"] = ["MNIST", "FashionMNIST"] compare_results 
compare_results.set_index("dataset")["model_acc"].plot(kind="barh") plt.ylabel("dataset") plt.xlabel("accuracy(%)"); 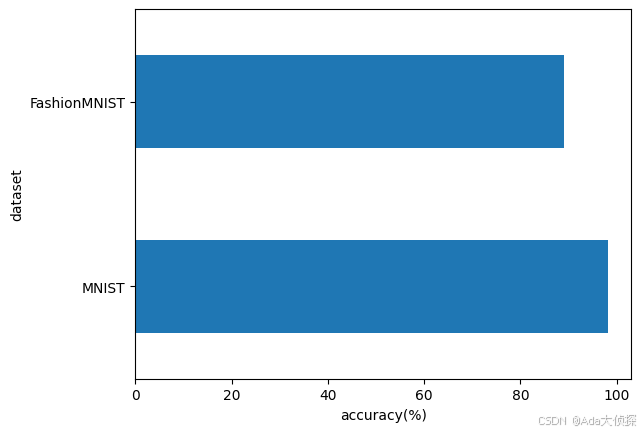
import random test_samples = [] test_labels = [] for sample, label in random.sample(list(fashion_test_data), k=9): test_samples.append(sample) test_labels.append(label) #查看第一个样本的形状 test_samples[0].shape torch.Size([1, 28, 28])
# make predictions pred_probs = make_prediction(model=model_0, data=test_samples, device=device) pred_classes = pred_probs.argmax(dim=1) # plot predictions plt.figure(figsize=(9,9)) nrows = 3 ncols = 3 for i, sample in enumerate(test_samples): plt.subplot(nrows, ncols, i+1) plt.imshow(sample.squeeze(), cmap="gray") pred_label = class_names[pred_classes[i]] truth_label = class_names[test_labels[i]] title_text = f"Pred:{pred_label} | Truth:{truth_label}" # 预测正确是绿色的title, 预测错误是红色的title if pred_label == truth_label: plt.title(title_text, fontsize=10, c="g") else: plt.title(title_text, fontsize=10, c="r") plt.axis(False); 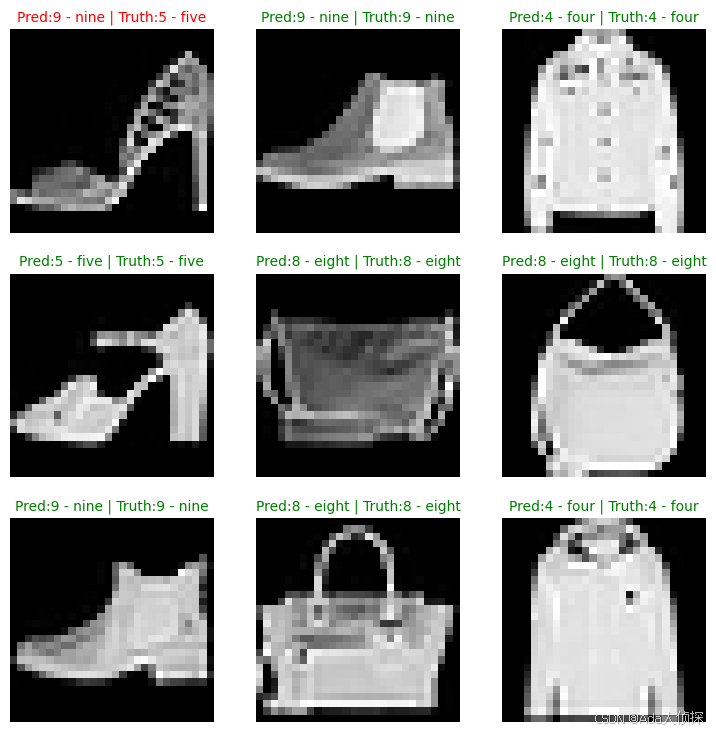
这这这,两个不同的数据集用了同一个模型,效果很明显是不一样的昂,我觉得数据的关系大一点吧,我们需要根据数据来调整模型的结构,或者用手段来提取数据特征让模型更好的学习,感觉都有关系,不过我认为还是要了解数据的结构,来构建模型,让模型学习数据中的模式。
OK,BB,终于把习题搞完了,oh, yeah, 取得了今天的小小胜利。
我今天在群里抢红包,运气王哎,获得了买一送一的优惠,刚刚尝了一下,很好吃的冬枣,看到这里,就把好运传给你咯,记得接一下~
晚上的米线很好吃,以至于忘记带回我的冬枣了,又回去拿啦,我送了一盒给那个小哥,一是感谢他,而是想分点好运给他,很开心,他应该也很开心吧~
好耶,BB,文档有用的话,给我点个赞赞~
谢谢您~
