🎯要点
🎯双图神经网络模型:最大后验推理和线性纠错码解码器 | 🎯重复结构和过约束问题超图推理模型 | 🎯无向图模型变量概率计算、和积消息传播图结构计算、隐马尔可夫模型图结构计算、矩阵图结构计算、图结构学习 | 🎯里程计和全球导航卫星系统空间机器人周身感应三维姿态图算法模型 | 🎯共轭梯度算法手机端行人轨迹(航位)预先推算图模型
📜图模型用例
📜Python和C++全球导航卫星系统和机器人姿态触觉感知二分图算法
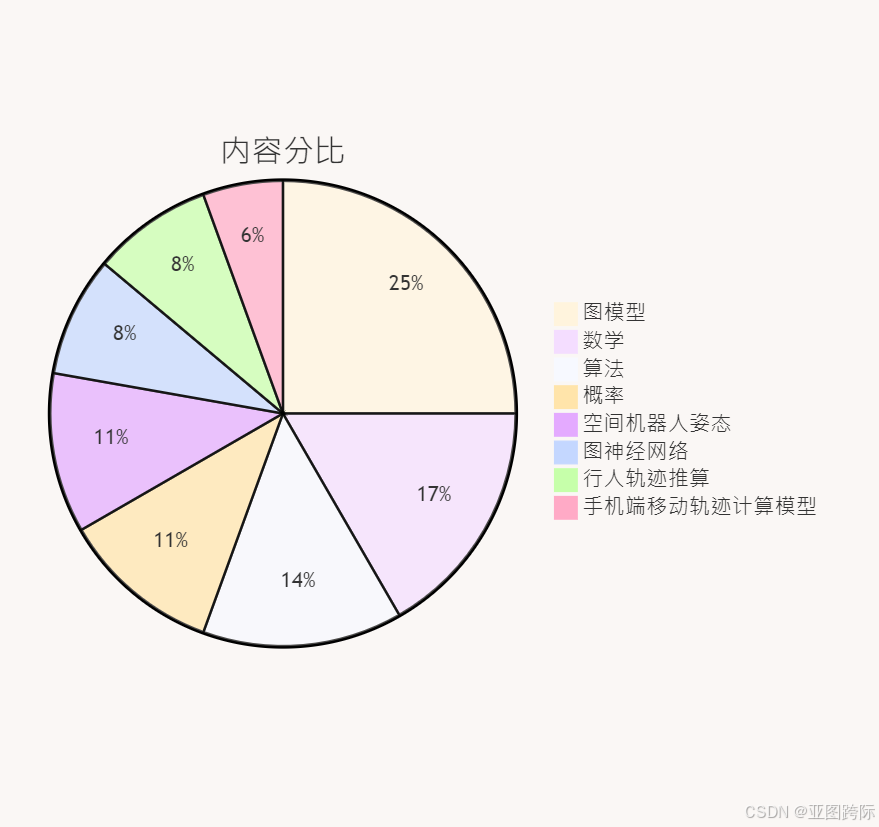
🍪语言内容分比


🍇Python最大后验
在贝叶斯统计中,最大后验概率估计是未知量的估计,等于后验分布的众数。最大后验概率可用于根据经验数据获得未观测量的点估计。它与最大似然估计方法密切相关,但采用增强优化目标,该目标将先验分布(量化通过对相关事件的先验知识获得的额外信息)与想要估计的数量相结合。因此,最大后验概率估计可以看作是最大似然估计的正则化。
假设我们要根据观测值 x x x 来估计未观测到的总体参数 θ \theta θ。令 f f f为 x x x的抽样分布,因此 f ( x ∣ θ ) f(x \mid \theta) f(x∣θ)是当基础总体参数为 θ \theta θ时 x x x的概率。然后函数:
θ ↦ f ( x ∣ θ ) \theta \mapsto f(x \mid \theta) θ↦f(x∣θ)
称为似然函数,估计为:
θ ^ M L E ( x ) = arg max f ( x ∣ θ ) \hat{\theta}_{ MLE }(x)=\arg \max f(x \mid \theta) θ^MLE(x)=argmaxf(x∣θ)
是 θ \theta θ 的最大似然估计。
现在假设存在 θ \theta θ 上的先验分布 g g g。这允许我们将 θ \theta θ 视为贝叶斯统计中的随机变量。我们可以使用贝叶斯定理计算 θ \theta θ 的后验分布:
θ ↦ f ( θ ∣ x ) = f ( x ∣ θ ) g ( θ ) ∫ Θ f ( x ∣ ϑ ) g ( ϑ ) d ϑ \theta \mapsto f(\theta \mid x)=\frac{f(x \mid \theta) g(\theta)}{\int_{\Theta} f(x \mid \vartheta) g(\vartheta) d \vartheta} θ↦f(θ∣x)=∫Θf(x∣ϑ)g(ϑ)dϑf(x∣θ)g(θ)
其中 g g g是 θ \theta θ的密度函数, Θ \Theta Θ是 g g g的定义域。
然后,最大后验估计方法将 θ \theta θ 估计为该随机变量的后验分布众数:
θ ^ MAP ( x ) = arg max θ f ( θ ∣ x ) = arg max θ f ( x ∣ θ ) g ( θ ) ∫ Θ f ( x ∣ ϑ ) g ( ϑ ) d ϑ = arg max θ f ( x ∣ θ ) g ( θ ) . \begin{aligned} \hat{\theta}_{\text {MAP }}(x) & =\underset{\theta}{\arg \max } f(\theta \mid x) \\ & =\underset{\theta}{\arg \max } \frac{f(x \mid \theta) g(\theta)}{\int_{\Theta} f(x \mid \vartheta) g(\vartheta) d \vartheta} \\ & =\underset{\theta}{\arg \max } f(x \mid \theta) g(\theta) . \end{aligned} θ^MAP (x)=θargmaxf(θ∣x)=θargmax∫Θf(x∣ϑ)g(ϑ)dϑf(x∣θ)g(θ)=θargmaxf(x∣θ)g(θ).
后验分布的分母(所谓的边际似然)始终为正,并且不依赖于 θ \theta θ,因此在优化中不起作用。观察到,当先验 g g g 均匀时(即 g g g 是常数函数), θ \theta θ 的最大后验概率估计与最大似然估计一致。
我们可以使用任何优化技术,可能是微积分,最好是梯度上升,以计算参数的最优值,该最优值将最大化后验,即 θ \theta θ参数现在也将伴随先验置信和似然性,并且会比 最大似然估计更好。
为了继续执行最大后验概率代码,我们将以给定相关数据点的帕累托分布为例,然后通过最大化后验概率来估计参数的最佳值,其中似然函数是帕累托,先验函数是正态分布,即 g ( α ) g(\alpha) g(α),因此解 α \alpha α 上的 argmax 可以最大化后验概率
import numpy as np import matplotlib.pyplot as plt from scipy.optimize import fmin from scipy.stats import norm data = np.array([ 1.677, 3.812, 1.463, 2.641, 1.256, 1.678, 1.157, 1.146, 1.323, 1.029, 1.238, 1.018, 1.171, 1.123, 1.074, 1.652, 1.873, 1.314, 1.309, 3.325, 1.045, 2.271, 1.305, 1.277, 1.114, 1.391, 3.728, 1.405, 1.054, 2.789, 1.019, 1.218, 1.033, 1.362, 1.058, 2.037, 1.171, 1.457, 1.518, 1.117, 1.153, 2.257, 1.022, 1.839, 1.706, 1.139, 1.501, 1.238, 2.53, 1.414, 1.064, 1.097, 1.261, 1.784, 1.196, 1.169, 2.101, 1.132, 1.193, 1.239, 1.514, 2.764, 1.853, 1.267, 1.015, 1.789, 1.099, 1.253, 1.418, 1.494, 4.015, 1.459, 2.175, 2.044, 1.551, 4.095, 1.396, 1.262, 1.351, 1.121, 1.196, 1.391, 1.305, 1.141, 1.157, 1.155, 1.261, 1.048, 1.918, 1.889, 1.068, 1.811, 1.198, 1.361, 1.261, 4.093, 2.925, 1.133, 1.573 ]) def pareto_log_likelihood(alpha, data): if alpha <= 0: return -np.inf n = len(data) log_likelihood = n * np.log(alpha) - (alpha + 1) * np.sum(np.log(data)) return log_likelihood def log_prior(alpha): mean = 2.5 std = 3 log_prior_prob = norm.logpdf(alpha, loc=mean, scale=std) return log_prior_prob initial_guess = 2 alpha_map = fmin(lambda alpha: -log_posterior(alpha, data), x0=[initial_guess], disp=False)[0] print("MAP estimate for alpha:", alpha_map) alpha_values = np.linspace(0.1, 10, 100) log_posterior_values = [log_posterior(alpha, data) for alpha in alpha_values] plt.figure(figsize=(10, 6)) plt.plot(alpha_values, log_posterior_values, label='Log-Posterior (MAP) Function') plt.axvline(alpha_map, color='r', linestyle='--', label=f'MAP estimate (α={alpha_map:.2f})') plt.scatter([alpha_map], [log_posterior(alpha_map, data)], color='red') plt.title('Log-Posterior (MAP) Function for Different α values') plt.xlabel('α (Alpha)') plt.ylabel('Log-Posterior') plt.legend() plt.grid(True) plt.show() 