阅读量:0


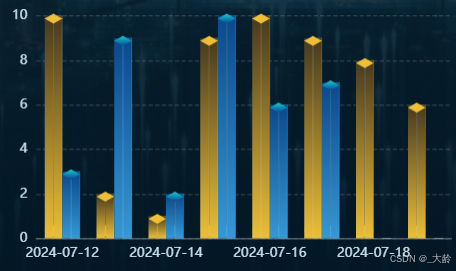
代码如下,单个的调第一个方法,多个柱状的调第二个方法,具体情况修改参数或者二次开发即可
//3d柱状图 export function getEcharts3DBar (xAxisData:string[]=['name1','name2','name3'], data:number[]=[1,2,3], colorObj:IBaseObject={ topStartColor:'rgba(236, 191, 55)', topEndColor:'rgba(236, 191, 55)', startColor:'rgba(71, 57, 30)', endColor:'rgba(236, 191, 55)', bottomStartColor:'rgba(236, 191, 55)', bottomEndColor:'rgba(236, 191, 55)' }) { return { tooltip: { trigger: "axis", axisPointer: { type: 'shadow' }, backgroundColor:'rgba(255,255,255,.1)', borderColor:'rgba(40, 60, 74)', textStyle:{ align:'left', fontSize: 10,//字体大小 color:'#fff', }, formatter: function (params) { var str = params[0].axisValue + ":" +params[0].value; return str; }, }, grid: { left: "3%", //图表距边框的距离 right: "3%", top: "15%", bottom: "5%", containLabel: true, }, xAxis: { data: xAxisData, axisTick: { show: false, }, axisLabel: { color: '#cae2ee' // 设置Y轴文字颜色为蓝色 } }, yAxis: { type: 'value', splitLine: { show: 'ture', // 是否显示y轴分割线 interval: 'auto', // 坐标轴分隔线的显示间隔 lineStyle: { color: ['rgba(232,236,239,.2)'], // 分隔线颜色。 width: 1, // 分隔线线宽 type: 'dashed', // 线的类型 opacity: 1 // 图形透明度。支持从 0 到 1 的数字,为 0 时不绘制该图形。 } }, axisLabel: { color: '#cae2ee' // 设置Y轴文字颜色为蓝色 } }, series: [ // 数据低下的圆片 { name: '', type: 'pictorialBar', symbol: 'diamond', symbolSize: [16,10], // 宽,高 symbolOffset: