阅读量:0
目录
基本介绍
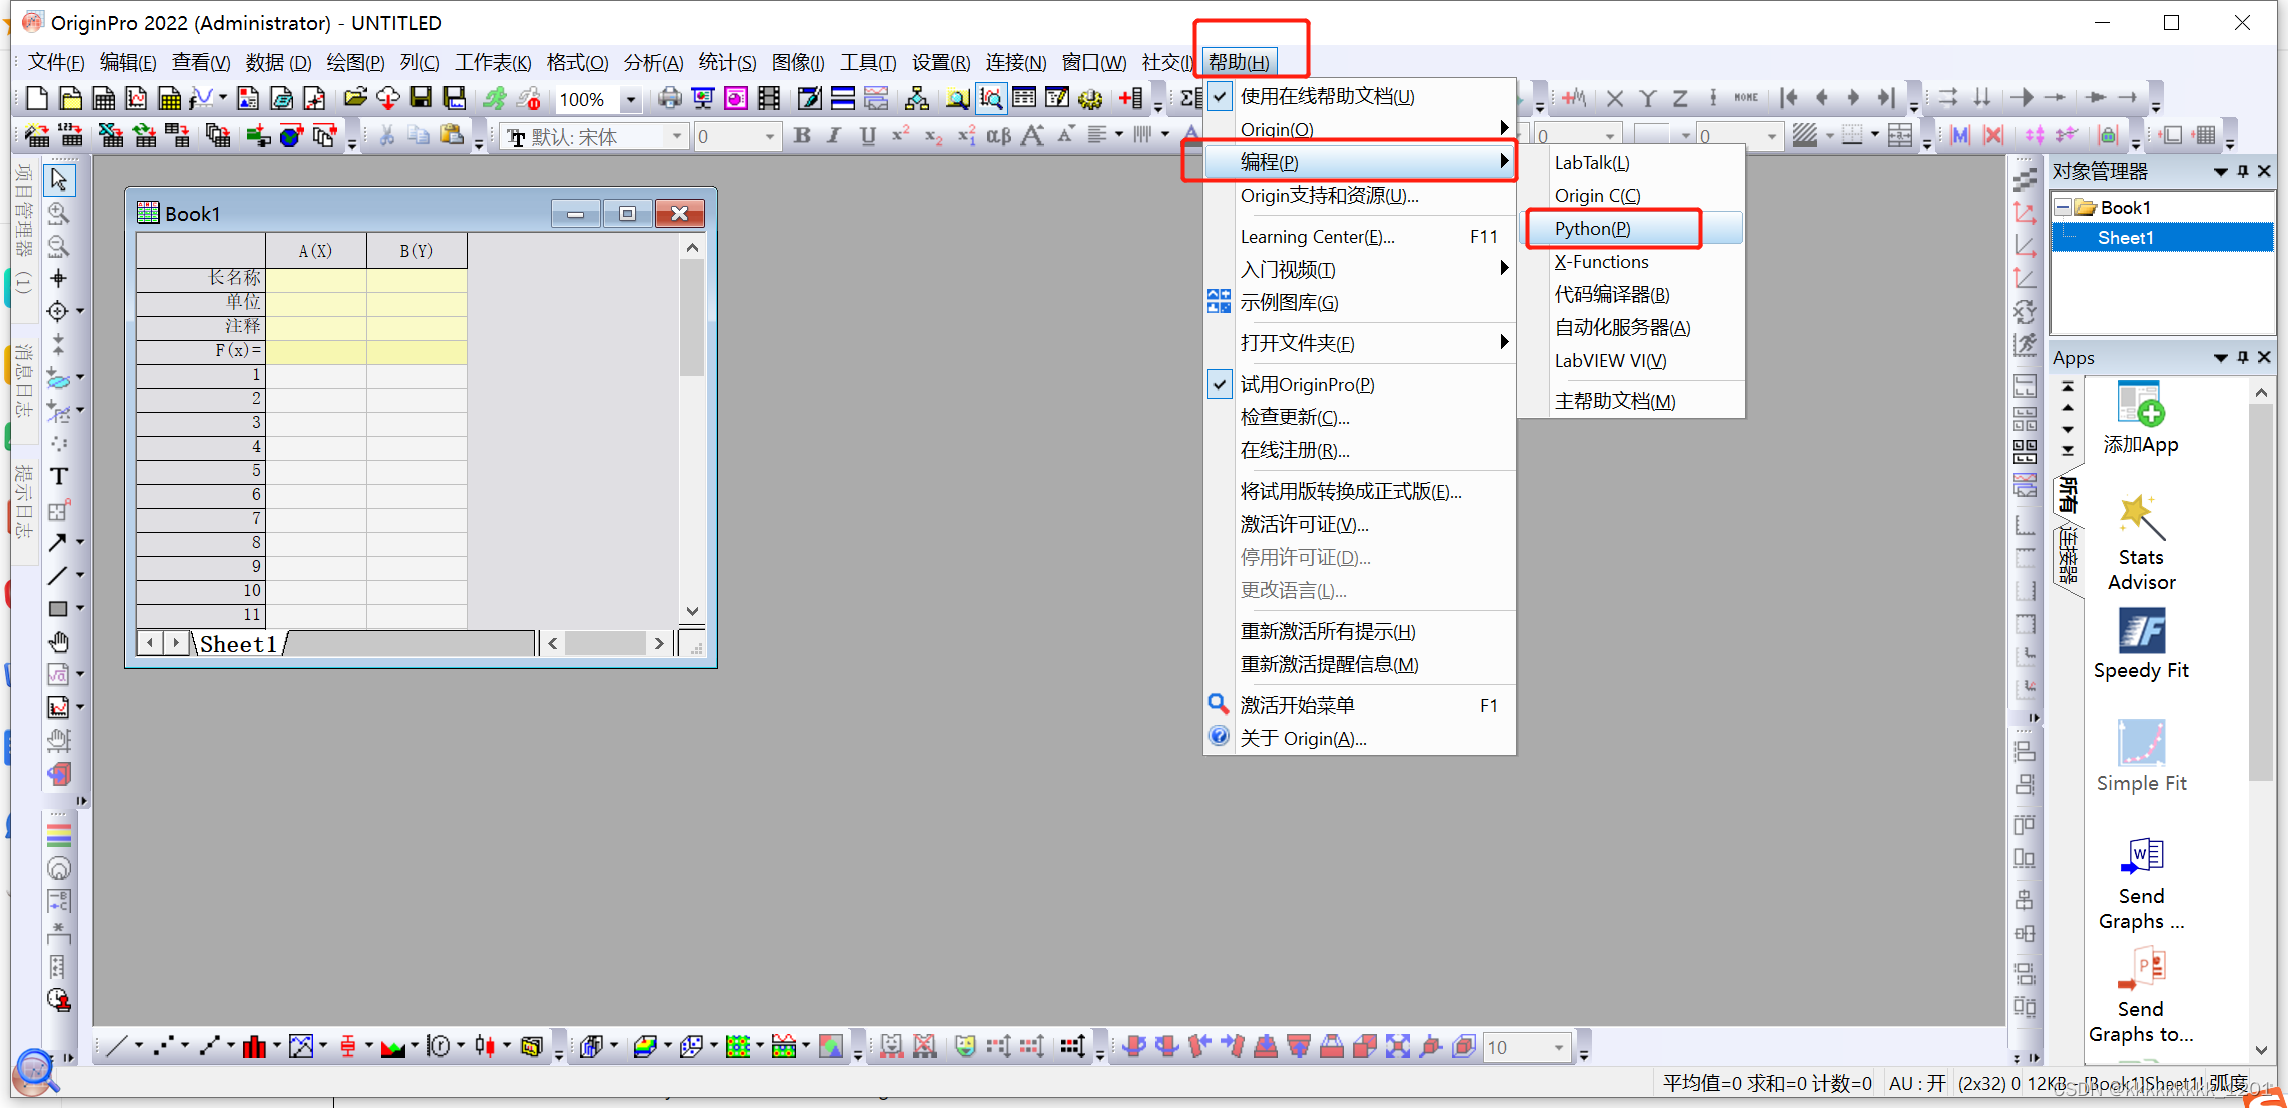
origin2021后可以使用python实现批量绘图,一共有两种方式:一种是嵌入式Python,一种是外部Python访问Origin。详细介绍可以自己去查看,打开origin->帮助->编程->python,就可以打开网页 link查看。
这里主要介绍比较少人提及的外部Python访问Origin方式,内部太麻烦了,对于习惯使用pycharm的我来说。
环境配置
还是熟悉的Anaconda Prompt,然后配置需要使用到的环境。首先先创建一个origin环境,然后激活环境后进行pip安装。这里conda install会报错的
创建环境见我其他配置教程: 【框架安装】win7 配置安装tensorflow和keras教程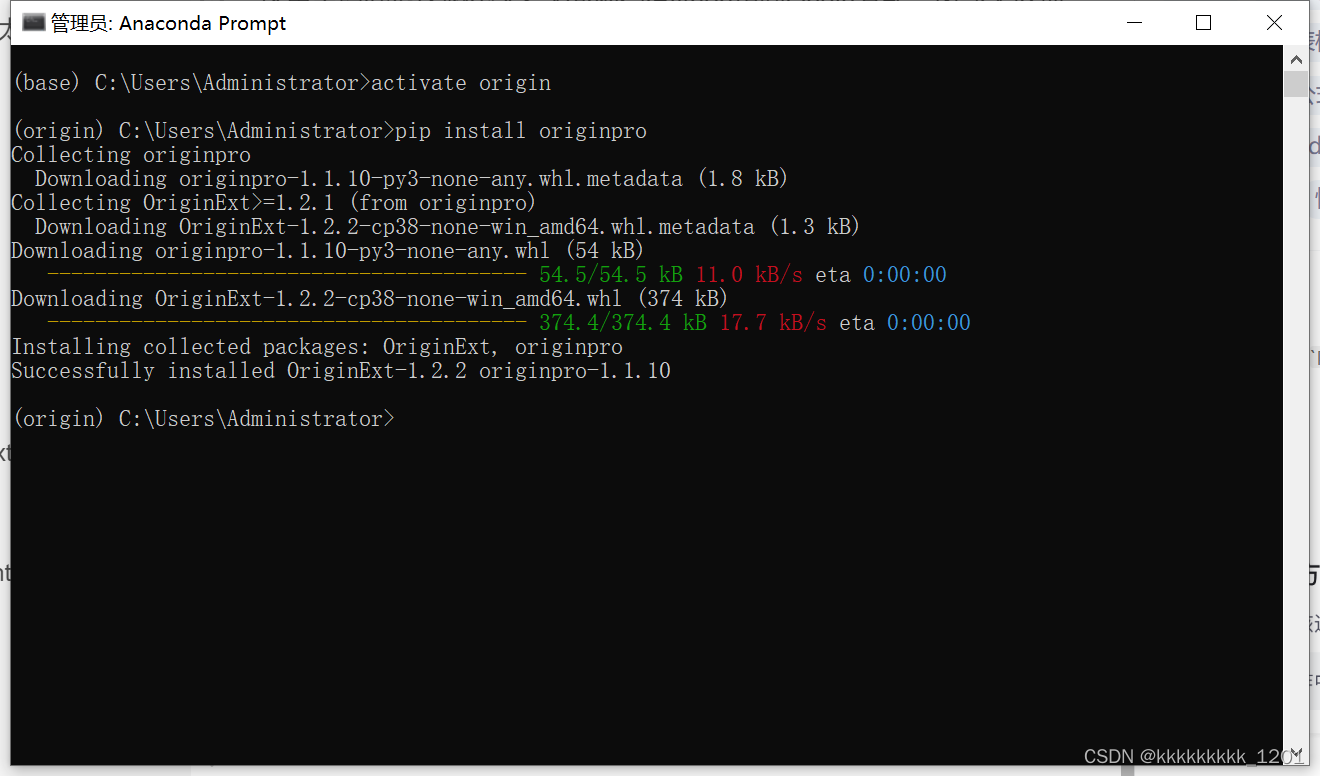
pip install originpro 然后就打开pycharm创建新项目,设置环境。见我其他配置教程: 【框架安装】win7 配置安装tensorflow和keras教程
官方代码示例
代码示例:https://www.originlab.com/doc/en/ExternalPython/External-Python-Code-Samples
更多代码示例:https://github.com/originlab/Python-Samples
官方函数指南:https://docs.originlab.com/originpro/annotated.html
基础代码详解
这里部分代码有删减,不可以直接运行!!!可以参考下面步骤流程写自己的代码!!!
part1 初始化
import os import originpro as op import numpy as np import pandas as pd # Very useful, especially during development, when you are liable to have a few uncaught exceptions. # Ensures that the Origin instance gets shut down properly. # Note: only applicable to external Python. # 官网推荐加的,不加白不加 import sys def origin_shutdown_exception_hook(exctype, value, traceback): '''Ensures Origin gets shut down if an uncaught exception''' op.exit() sys.__excepthook__(exctype, value, traceback) if op and op.oext: sys.excepthook = origin_shutdown_exception_hook part2 打开origin界面(也可以不打开的,但是打开可控一点)
# Set Origin instance visibility. # Important for only external Python. # Should not be used with embedded Python. # 这个命令可以打开一个origin界面 if op.oext: op.set_show(True) part3 读取数据并进行数据处理
# 可以实现设置一个origin模板,这样可以减轻工作量 # 这里先设置好模板读取路径template_path,以及图片保存路径save_img_path # 可以看这个教程:https://blog.originlab.com/origin-graph-templates-for-python-developers working_folder = os.path.dirname(os.path.realpath(__file__)) template_path = os.path.join(working_folder,'test111.otpu') save_img_path = working_folder # 可以使用pandas 和numpy 处理数据 data = pd.read_csv(csv_path, header=None) data = np.array(data).flatten() part4 新建表格,并将数据输入到表格
# Simple syntax to create a new workbook with one sheet wks = op.new_sheet('w','test') # Insert list data into columns 1 # 这里0指的是第一列,1指的是第二列,data就是要输入进去的列向量np格式数据,列名设置为???。这里输入两列相同的数据 # 注意这个列名会显示到图上面的 wks.from_list(0, data, lname='???') wks.from_list(1, data, lname='???') part5 绘图
# Create a new graph object based on a graph template. # Provide path to the template. We'll use a built-in gr = op.new_graph(template=template_path) # Add plots with data from worksheet to layer 1 and layer 2 # and then rescale. # p1 就是绘制的第一条曲线, p1 = gr[0].add_plot(wks, coly='B', colx='A') # X is col A, Y is col B. p1.color = '#335eff' # 设置曲线颜色 # 可以到这个网站找合适的配色:https://eng.m.fontke.com/tool/rgb/ # p2 就是绘制的第二条曲线 p2 = gr[0].add_plot(wks, 'C', 'A') # X is col A, Y is col C. p2.color = '#ff5833' part6 保存图片
# 保存图片 f=gr.save_fig(os.path.join(save_img_path,'my_py_test.png')) # 打开刚刚保存的图片 if len(f): os.startfile(f) part7 退出origin
# Exit running instance of Origin. if op.oext: op.exit() 我的代码效果视频