
阅读量:2
<!-- * @Author: liszter <liszter@qq.com> * @Date: 2024-07-11 16:06:39 * @LastEditTime: 2024-07-11 18:25:36 * @LastEditors: lishutao * @Description: 暂无 * @FilePath: \vueee\src\components\record-draw\record-draw-html\index.vue --> <template> <div class="record-page"> <div class="container"> <div v-for="(item, index) of divList" :key="index" :style="{ 'transform': `scaleY(${item})` }" class="div-bar"> </div> </div> <div> <button @click="() => initAudio()">开始录音</button> </div> </div> </template> <script setup> import { onMounted, ref } from "vue"; // 默认缩放比例为1 const divList = ref([ 1, 1, 1, 1, 1, 1, 1, 1, 1, 1, 1, 1, 1, 1, 1, 1, 1, 1, 1, 1, 1, 1, 1, 1, 1, 1, 1, 1, 1, 1, 1, 1, ]); // 定义全局变量 let audioContext; let analyser; let dataArray; // 数据处理方法 /** * @descript 描述: 因为频谱可视化给的数据是个大数组,例如 Array[2024], 肯定不能全部展示 * 因此,按照一定的规律取一部分数据。 * @params step 间隔多少个取一次 * @params number 从数组中一共取n个数据 * @params arr 目标数组 * @returns res 获取到的数组结果 * 默认限制最终的音频数据范围 1-10, 这样的话显示的动画比较明显,可配置 * @param { scaleMin } number 限制最小值 ,默认1 * @param { scaleMax } number 限制最大值 ,默认10 * @param { scale } number 最终效果放大倍数 默认1 * **/ function getDataArrayList(arr, number, scaleMin = 1, scaleMax = 10, scale = 4) { // 最大 arr.length 间隔arr.length/ number 去一个数 // 大概是这个范围,具体为什么是128 我也纳闷。。。 const baseValue = 128 const res = []; let step = arr.length / number; for (let i = 0; i < number; i++) { // 每一项的值 和 baseValue 取差 let currentVal = arr[Math.floor((arr.length / step) * i)] - baseValue // 处理一下 要求这个值最小是1 ,最大是4 let limit = scaleMin if (currentVal > scaleMax) { limit = scaleMax } else if (currentVal < scaleMax && currentVal > scaleMin) { limit = currentVal } else { limit = scaleMin } res.push(limit * scale); } return res; } // 初始化函数 function initAudio() { // 获取音频上下文 audioContext = new (window.AudioContext || window.webkitAudioContext)(); // 获取麦克风数据 navigator.mediaDevices .getUserMedia({ audio: true }) .then(function (stream) { // 连接音频流到分析器 analyser = audioContext.createAnalyser(); analyser.fftSize = 2048; let source = audioContext.createMediaStreamSource(stream); source.connect(analyser); // 获取频谱数据 dataArray = new Uint8Array(analyser.fftSize); // 开始绘制波形图 draw(); }) .catch(function (err) { console.log("获取麦克风失败:" + err); }); } // 绘制函数 function draw() { // 获取频谱数据 analyser.getByteTimeDomainData(dataArray); // 处理数据 let localArr = getDataArrayList(dataArray, 32) localArr.forEach((item, index) => { divList.value[index] = item }) setTimeout(() => { draw() }, 16.7 * 5) } </script> <style scoped> .record-page { display: flex; } .container { border: solid 1px #e3e3e3; display: flex; align-items: center; padding: 20px; } .container>div { width: 2px; margin-left: 5px; background-color: #008cff; height: 1px; transition: all 0.16s ease; } </style> 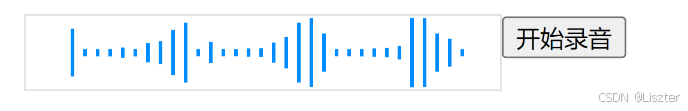
实现的效果嘛, 就是你说话期间,这一些柱子会跟着跳动。
逻辑参考代码,大概就这样。 其他波形图也能绘制,你若没想法,来评论区交流。
