阅读量:2
文章目录
前言
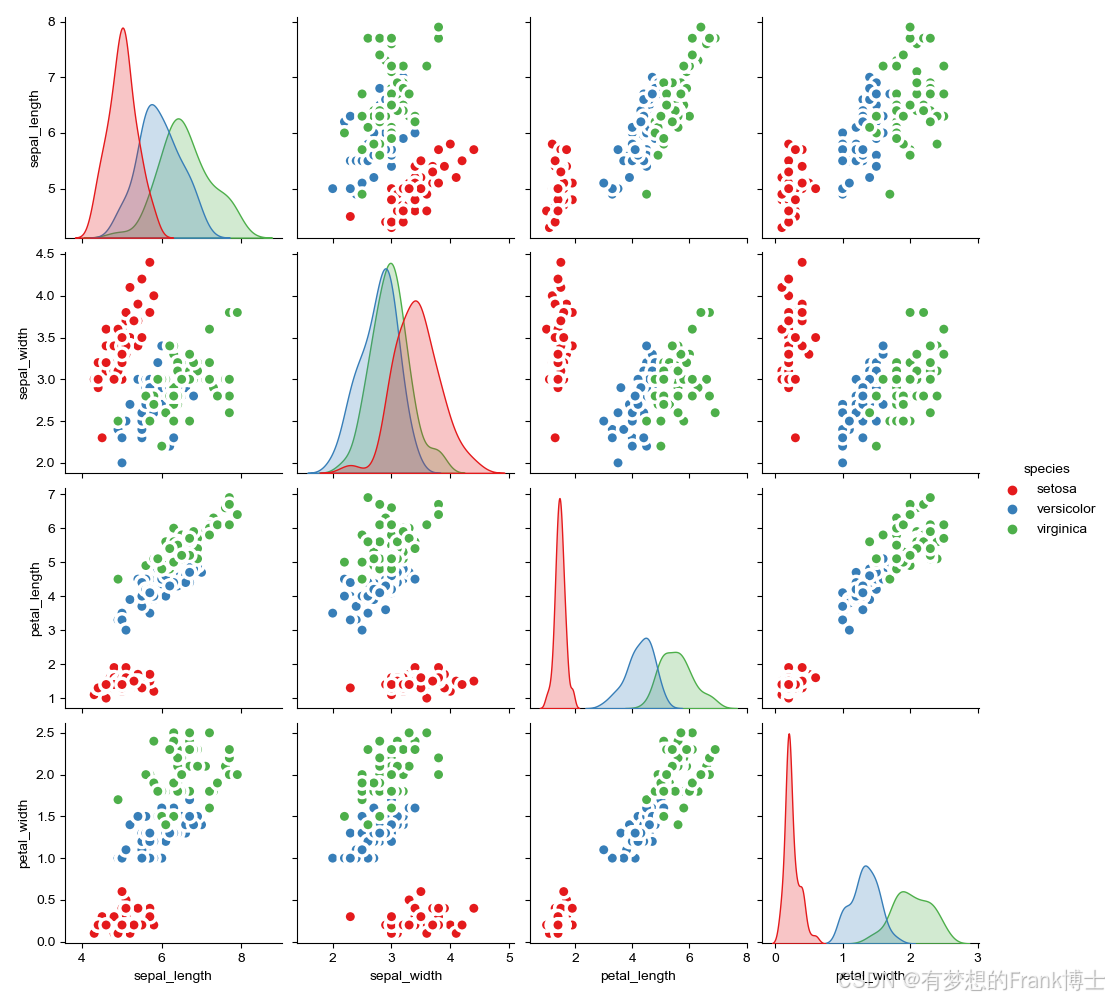
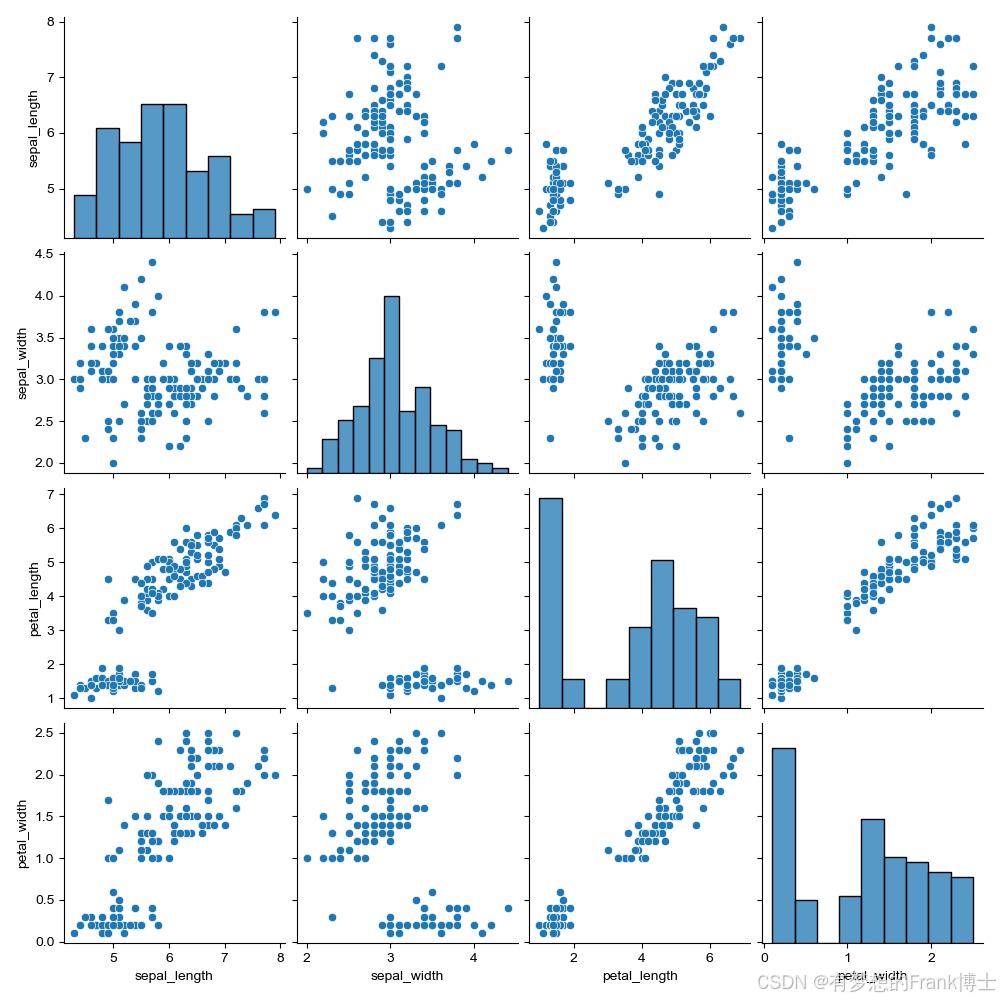
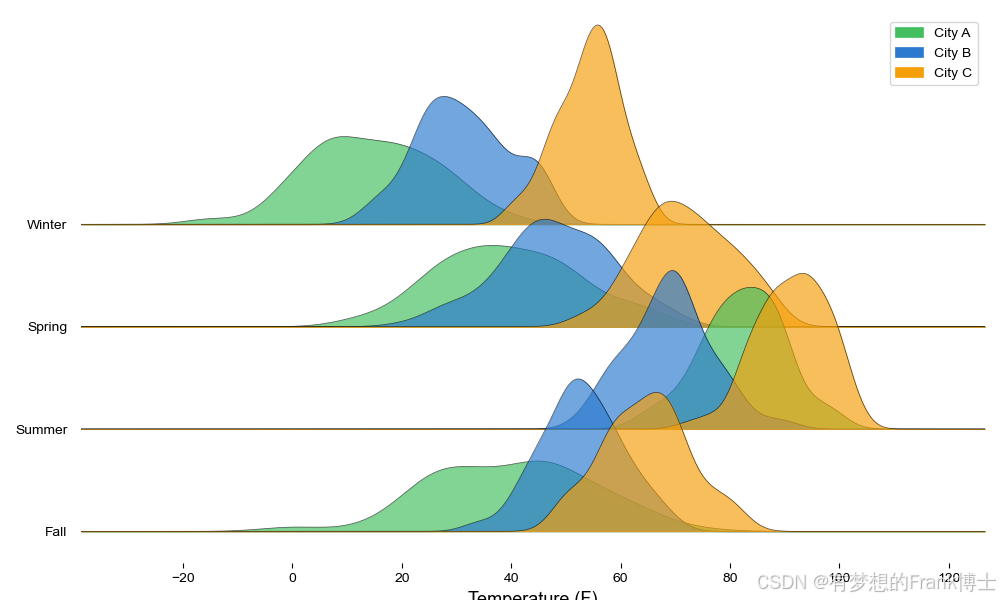
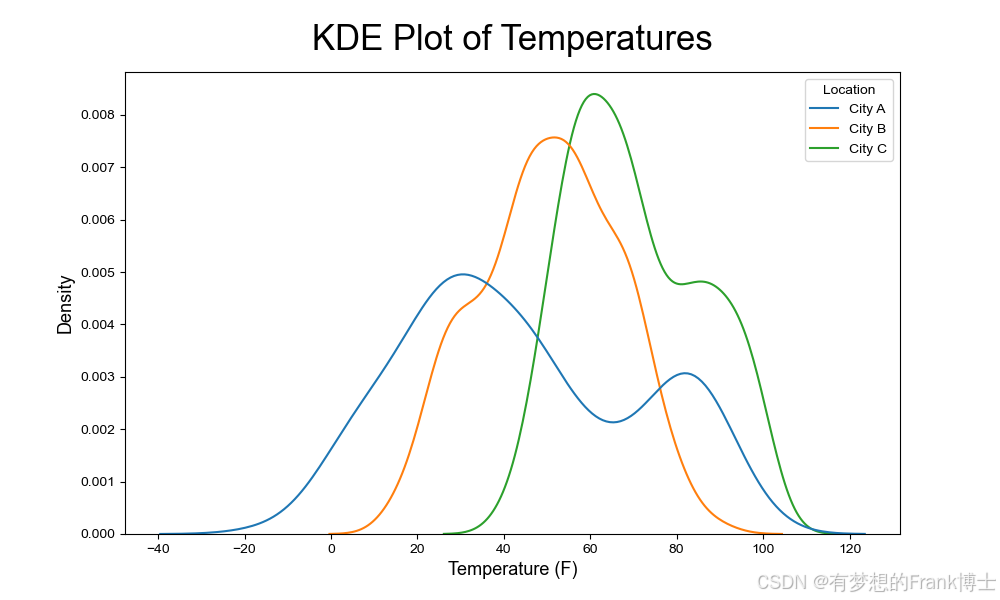
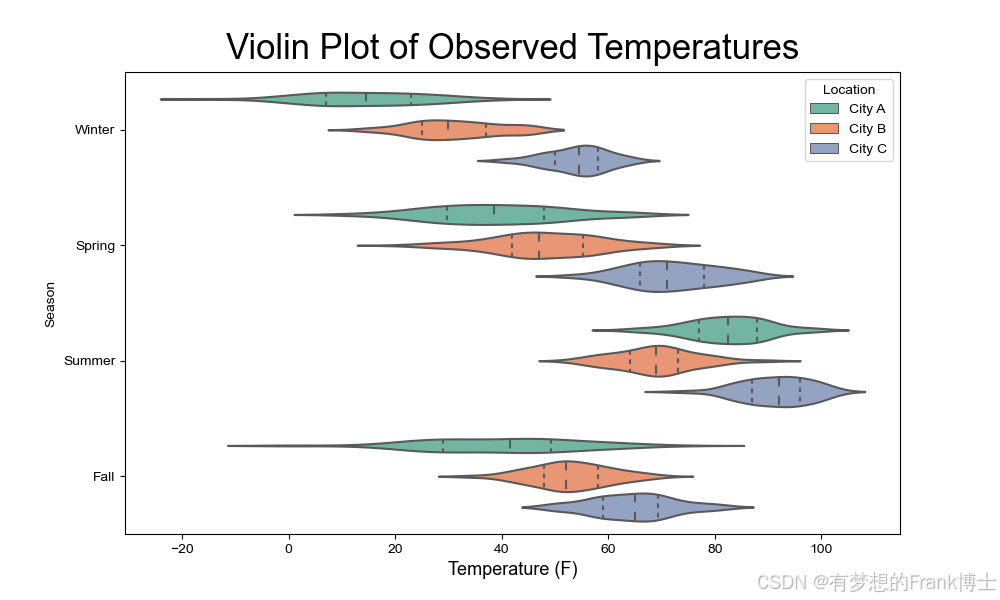
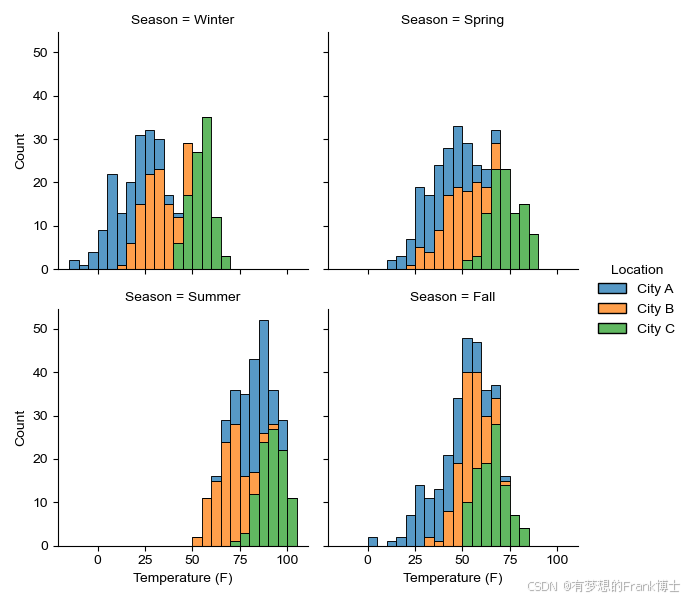
本文演示了使用Python进行温度数据的多样化可视化方法。通过导入、处理和分析气象数据,我们生成了多种图表,包括直方图、核密度估计图、箱型图、小提琴图、条形图、山脊图、经验累积分布函数图和折线图。这些图表帮助我们更直观地理解温度数据的分布和变化趋势。我们利用了Seaborn、Matplotlib和Plotly等数据可视化库,以美观和易于理解的方式展示数据。
代码
# Import necessary libraries import pandas as pd from pandas.api.types import CategoricalDtype import seaborn as sns import matplotlib.pyplot as plt import plotly.express as px from joypy import joyplot # 导入数据 df = pd.read_csv('D:/Pythonmatlab/2326060760python数据分布/weatherData.csv') # 设置季节为分类数据类型 season = CategoricalDtype(['Winter', 'Spring', 'Summer', 'Fall']) df['Season'] = df['Season'].astype(season) # 打印前5行数据 print(df.head(5)) #%% # 直方图 # 设置图表大小 plt.figure(figsize=(10, 6)) # 生成直方图 sns.histplot(df, x='Temp') # 显示图表 plt.show() #%% # 分地点的堆叠直方图 # 设置图表大小 plt.figure(figsize=(10, 6)) # 生成堆叠直方图 sns.histplot(df, x='Temp', hue='Location', multiple='stack') # 设置标签 plt.title('Distribution of All Observed Temperatures', fontsize=25, y=1.03) plt.xlabel('Temperature (F)', fontsize=13) plt.ylabel('Count', fontsize=13) # 显示图表 plt.show() #%% # 分季节的直方图 # 生成分季节的直方图 g = sns.displot(df, x='Temp', col='Season', hue='Location', multiple='stack', binwidth=5, height=3, col_wrap=2, facet_kws=dict(margin_titles=False)) # 设置轴标签 g.set_axis_labels('Temperature (F)', 'Count') # 显示图表 plt.show() #%% # 分季节的垂直直方图 # 生成分季节的垂直直方图 g = sns.displot(df, x='Temp', col='Season', hue='Location', multiple='stack', binwidth=5, height=1, aspect=6, col_wrap=1, facet_kws=dict(margin_titles=True)) # 设置轴标签 g.set_axis_labels('Temperature (F)', 'Count', fontsize=17) # 显示图表 plt.show() #%% # Plotly直方图 # 设置图表大小 plt.figure(figsize=(10, 6)) # 生成Plotly直方图 plot = px.histogram(df, x='Temp', barmode='overlay', color='Location', facet_row='Season') # 设置标题和标签 plot.update_layout(title={'text': "Distributions of Temperature\ <br><sup>Sorted by Season and \ Location</sup>", 'xanchor': 'left', 'yanchor': 'top', 'x': 0.1}, legend_title_text='Location', xaxis_title='Recorded Temperature (F)') plot.for_each_annotation(lambda x: x.update(text=x.text.split("=")[1])) plot.update_yaxes(title='Count') # 设置颜色和背景 plot.update_layout(plot_bgcolor='white') plot.update_xaxes(showline=True, linecolor='gray') plot.update_yaxes(showline=True, linecolor='gray') # 显示图表 plot.show() #%% # 核密度估计图(KDE Plots) # 设置图表大小 plt.figure(figsize=(10, 6)) # 生成KDE图 sns.kdeplot(data=df, x='Temp', hue='Location', fill=False) # 设置标签 plt.title('KDE Plot of Temperatures', fontsize=25, y=1.03) plt.xlabel('Temperature (F)', fontsize=13) plt.ylabel('Density', fontsize=13) # 显示图表 plt.show() #%% # 分季节的KDE图 # 生成分季节的KDE图 g = sns.displot(df, x="Temp", col="Season", hue='Location', kind='kde', height=1, aspect=7, col_wrap=1, fill=True, facet_kws=dict(margin_titles=True)) # 设置轴标签 g.set_axis_labels('Temperature (F)', 'Density', fontsize=16) # 显示图表 plt.show() #%% # 分季节的带填充KDE图 # 生成分季节的带填充KDE图 g = sns.displot(df, x="Temp", col="Season", hue='Location', kde=True, height=1, aspect=7, col_wrap=1, fill=True, facet_kws=dict(margin_titles=True)) # 设置轴标签 g.set_axis_labels('Temperature (F)', 'Density', fontsize=16) # 显示图表 plt.show() #%% # 山脊图(Joy Plots or Ridge Plots) # 重塑数据 dfJoy = df.pivot(index=['Entry', 'Season'], columns='Location', values='Temp') print(dfJoy.head()) # 生成山脊图 fig, axes = joyplot(data=dfJoy, by='Season', column=['City A', 'City B', 'City C'], color=['#43bf60', '#2b7acf', '#f59f0a'], alpha=.67, legend=True, overlap=2, linewidth=.5, figsize=(10, 6)) # 设置标签 plt.xlabel('Temperature (F)', fontsize=13) # 显示图表 plt.show() #%% # 箱型图(Box Plots) # 生成箱型图 plot = px.box(df, x='Season', color='Location', y='Temp', color_discrete_sequence=px.colors.cyclical.IceFire) # 更新布局和标题 plot.update_layout(title={'text': "Seasonal Temperature Distributions\ <br><sup>By Season for Cities A, B, \ and C</sup>", 'xanchor': 'left', 'yanchor': 'top', 'x': 0.1}, legend_title_text='Location:', xaxis_title='', yaxis_title='Temperature (F)') # 更新样式 plot.update_layout(plot_bgcolor='white') plot.update_xaxes(showline=True, linecolor='gray') plot.update_yaxes(showline=True, linecolor='gray') # 显示图表 plot.show() #%% # 小提琴图(Violin Plots) # 设置图表大小 plt.figure(figsize=(10, 6)) # 生成小提琴图 sns.violinplot(data=df, x='Temp', y='Season', hue='Location', inner='quartile', palette='Set2') # 设置标签 plt.title('Violin Plot of Observed Temperatures', fontsize=25, y=1.01) plt.xlabel('Temperature (F)', fontsize=13) # 显示图表 plt.show() #%% # 分类数据散点图(Strip and Swarm Plots) # 设置图表大小 plt.figure(figsize=(10, 6)) # 生成strip plot sns.stripplot(data=df, x='Temp', y='Season', hue='Location', jitter=True, palette="magma", alpha=.75) # 设置标签 plt.title('Strip Plot of Observed Temperatures', fontsize=25, y=1.01) plt.xlabel('Temperature (F)', fontsize=13) # 显示图表 plt.show() #%% # 设置图表大小 plt.figure(figsize=(10, 6)) # 生成strip plot(带dodge选项) sns.stripplot(data=df, x='Temp', y='Season', hue='Location', jitter=True, palette="magma", dodge=True, alpha=.5) # 设置标签 plt.title('Strip Plot of Observed Temperatures', fontsize=25, y=1.01) plt.xlabel('Temperature (F)', fontsize=13) # 显示图表 plt.show() #%% # 设置图表大小 plt.figure(figsize=(10, 6)) # 生成swarm plot sns.swarmplot(data=df, x='Temp', y='Season', hue='Location', palette='magma') # 设置标签 plt.title('Swarm Plot of Observed Temperatures', fontsize=25, y=1.01) plt.xlabel('Temperature (F)', fontsize=13) # 显示图表 plt.show() #%% # 设置图表大小 plt.figure(figsize=(10, 6)) # 生成swarm plot(带dodge选项) sns.swarmplot(data=df, x='Temp', y='Season', hue='Location', palette='magma', dodge=True) # 设置标签 plt.title('Swarm Plot of Observed Temperatures', fontsize=25, y=1.01) plt.xlabel('Temperature (F)', fontsize=13) # 显示图表 plt.show() #%% # 经验累积分布函数图(ECDF Plots) # 生成ECDF图 sns.displot(df, x='Temp', hue='Location', kind='ecdf', height=5) # 设置标签 plt.xlabel('Temperature (F)', fontsize=13) # 显示图表 plt.show() #%% # 分季节的ECDF图 # 生成分季节的ECDF图 g = sns.displot(df, x='Temp', hue='Location', col='Season', kind='ecdf', height=4) # 设置轴标签 g.set_axis_labels('Temperature (F)', 'Cumulative Distribution') # 显示图表 plt.show() #%% # 折线图(Line Plots) # 设置图表大小 plt.figure(figsize=(10, 6)) # 生成折线图 sns.lineplot(data=df, x='Entry', y='Temp', hue='Location', ci=None, palette='tab10') # 设置标签 plt.title('Temperature Trends Over Time', fontsize=25, y=1.01) plt.xlabel('Entry', fontsize=13) plt.ylabel('Temperature (F)', fontsize=13) # 显示图表 plt.show() #%% # 分季节的折线图 # 生成分季节的折线图 g = sns.relplot(data=df, x='Entry', y='Temp', hue='Location', kind='line', col='Season', col_wrap=1, height=4, aspect=5, facet_kws=dict(margin_titles=True)) # 设置轴标签 g.set_axis_labels('Entry', 'Temperature (F)', fontsize=16) # 显示图表 plt.show() #%% # 分地点的折线图 # 生成分地点的折线图 g = sns.relplot(data=df, x='Entry', y='Temp', hue='Season', kind='line', col='Location', col_wrap=1, height=4, aspect=5, facet_kws=dict(margin_titles=True)) # 设置轴标签 g.set_axis_labels('Entry', 'Temperature (F)', fontsize=16) # 显示图表 plt.show() # Create Displot: g = sns.displot(df, x='Temp', col='Season', hue='Location', kind='ecdf', height=3, col_wrap=2, facet_kws=dict(margin_titles=True)) # Set labels: # g.fig.suptitle('Distributions of Temperature by Season', # fontsize=25, x=0.47, y=1.03, ha='center') g.set_axis_labels('Temperature (F)', 'Count') plt.show() #%% df = sns.load_dataset('iris') # Plot plt.figure(figsize=(10, 8), dpi=80) sns.pairplot(df, kind="scatter", hue="species", palette='Set1', plot_kws=dict(s=80, edgecolor="white", linewidth=2.5)) plt.show() #%% df = sns.load_dataset('iris') # Plot sns.pairplot(df) plt.show() # 导入鸢尾花数据集 df = sns.load_dataset('iris') # 绘制配对图 plt.figure(figsize=(10, 8), dpi=80) sns.pairplot(df, kind="scatter", hue="species", palette='Set1', plot_kws=dict(s=80, edgecolor="white", linewidth=2.5)) plt.show() #%% # 再次导入鸢尾花数据集 df = sns.load_dataset('iris') # 绘制简单的配对图 sns.pairplot(df) plt.show() 效果展示
