
阅读量:1
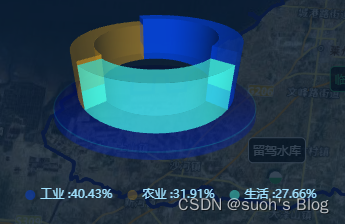
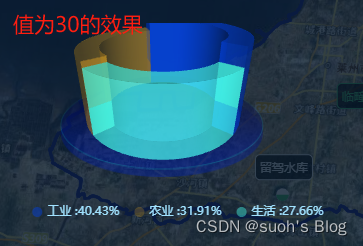
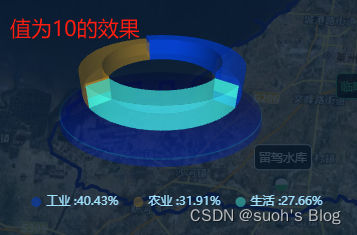
先看效果,再看文章:
一、安装插件
3d的图不仅用到echarts,还用到了echarts-gl,因此都需要安装一下哦~
npm install echarts npm install echarts-gl@2.0.9 //可以指定版本,也可不指定 二、在main.js中引入
import * as echarts from "echarts"; import 'echarts-gl'; Vue.prototype.$echarts = echarts;三、在组件中使用
直接复制粘贴吧,省事
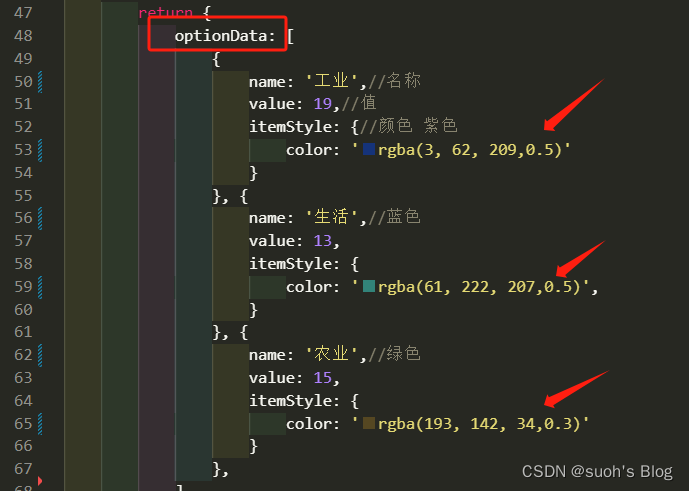
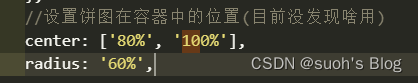
<template> <div class="ybjgtzz"> <!-- 饼图 --> <div class="container"> <div class="chartsGl" id="charts"></div> <!-- 饼图下面的底座 --> <div class="buttomCharts"></div> </div> </div> </template> <script> export default { name: "Zysjg", data() { return { optionData: [ { name: '工业',//名称 value: 19,//值 itemStyle: {//颜色 color: 'rgba(3, 62, 209,0.5)' } }, { name: '生活', value: 13, itemStyle: { color: 'rgba(61, 222, 207,0.5)', } }, { name: '农业', value: 15, itemStyle: { color: 'rgba(193, 142, 34,0.3)' } }, ], option: {} }; }, mounted() { this.$nextTick(() => { this.init(); }); }, methods: { //初始化构建 init() { //构建3d饼状图 let myChart = this.$echarts.init(document.getElementById('charts')); // 传入数据生成 option ; getPie3D(数据,透明的空心占比(调节中间空心范围的0就是普通饼1就很镂空)) this.option = this.getPie3D(this.optionData, 0.85); //将配置项设置进去 myChart.setOption(this.option); //鼠标移动上去特效效果 // this.bindListen(myChart); }, //配置构建 pieData 饼图数据 internalDiameterRatio:透明的空心占比 getPie3D(pieData, internalDiameterRatio) { let that = this; let series = []; let sumValue = 0; let startValue = 0; let endValue = 0; let legendData = []; let legendBfb = []; let k = 1 - internalDiameterRatio; pieData.sort((a, b) => { return (b.value - a.value); }); // 为每一个饼图数据,生成一个 series-surface(参数曲面) 配置 for (let i = 0; i < pieData.length; i++) { sumValue += pieData[i].value; let seriesItem = { //系统名称 name: typeof pieData[i].name === 'undefined' ? `series${i}` : pieData[i].name, type: 'surface', //是否为参数曲面(是) parametric: true, //曲面图网格线(否)上面一根一根的 wireframe: { show: false }, pieData: pieData[i], pieStatus: { selected: false, hovered: false, k: k }, //设置饼图在容器中的位置(目前没发现啥用) center: ['80%', '100%'], radius: '60%', }; //曲面的颜色、不透明度等样式。 if (typeof pieData[i].itemStyle != 'undefined') { let itemStyle = {}; typeof pieData[i].itemStyle.color != 'undefined' ? itemStyle.color = pieData[i].itemStyle.color : null; typeof pieData[i].itemStyle.opacity != 'undefined' ? itemStyle.opacity = pieData[i].itemStyle.opacity : null; seriesItem.itemStyle = itemStyle; } series.push(seriesItem); } // 使用上一次遍历时,计算出的数据和 sumValue,调用 getParametricEquation 函数, // 向每个 series-surface 传入不同的参数方程 series-surface.parametricEquation,也就是实现每一个扇形。 legendData = []; legendBfb = []; for (let i = 0; i < series.length; i++) { endValue = startValue + series[i].pieData.value; series[i].pieData.startRatio = startValue / sumValue; series[i].pieData.endRatio = endValue / sumValue; series[i].parametricEquation = that.getParametricEquation(series[i].pieData.startRatio, series[i].pieData.endRatio, false, false, k, series[i].pieData.value); startValue = endValue; let bfb = that.fomatFloat(series[i].pieData.value / sumValue, 4); legendData.push({ name: series[i].name, value: bfb }); legendBfb.push({ name: series[i].name, value: bfb }); } //(第二个参数可以设置你这个环形的高低程度) let boxHeight = this.getHeight3D(series, 20);//通过传参设定3d饼/环的高度 // 准备待返回的配置项,把准备好的 legendData、series 传入。 let option = { //图例组件 legend: { data: legendData, //图例列表的布局朝向。 orient: 'horizontal', center: 0, bottom: 0, //图例文字每项之间的间隔 itemGap: 15, textStyle: { color: '#A1E2FF', fontSize: '12px' }, itemHeight: 10, // 修改icon图形大小 itemWidth: 10, // 修改icon图形大小 show: true, icon: 'circle', //格式化图例文本(我是数值什么显示什么) formatter: function (name) { var target; for (var i = 0, l = pieData.length; i < l; i++) { if (pieData[i].name == name) { target = pieData[i].value; } } return `${name}: ${target}`; }, // 这个可以显示百分比那种(可以根据你想要的来配置) formatter: function (param) { let item = legendBfb.filter(item => item.name == param)[0]; let bfs = that.fomatFloat(item.value * 100, 2) + "%"; console.log(item.name) return `${item.name} :${bfs}`; } }, //移动上去提示的文本内容(我没来得及改 你们可以根据需求改) tooltip: { formatter: params => { if (params.seriesName !== 'mouseoutSeries' && params.seriesName !== 'pie2d') { let bfb = ((option.series[params.seriesIndex].pieData.endRatio - option.series[params.seriesIndex].pieData.startRatio) * 100).toFixed(2); return `${params.seriesName}<br/>` + `<span style="display:inline-block;margin-right:5px;border-radius:10px;width:10px;height:10px;background-color:${params.color};"></span>` + `${bfb}`; } } }, labelLine: { show: true, lineStyle: { color: '#7BC0CB', }, }, label: { show: true, position: 'outside', formatter: '{b} \n{c} {d}%', }, //这个可以变形 xAxis3D: { min: -1, max: 1 }, yAxis3D: { min: -1, max: 1 }, zAxis3D: { min: -1, max: 1 }, //此处是修改样式的重点 grid3D: { show: false, boxHeight: boxHeight, //圆环的高度 //这是饼图的位置 top: '-20.5%', left: '-4%', viewControl: { //3d效果可以放大、旋转等,请自己去查看官方配置 alpha: 25, //角度(这个很重要 调节角度的) distance: 160,//调整视角到主体的距离,类似调整zoom(这是整体大小) rotateSensitivity: 0, //设置为0无法旋转 zoomSensitivity: 0, //设置为0无法缩放 panSensitivity: 0, //设置为0无法平移 autoRotate: false //自动旋转 } }, series: series }; return option; }, //获取3d丙图的最高扇区的高度 getHeight3D(series, height) { series.sort((a, b) => { return (b.pieData.value - a.pieData.value); }) return height * 25 / series[0].pieData.value; }, // 生成扇形的曲面参数方程,用于 series-surface.parametricEquation getParametricEquation(startRatio, endRatio, isSelected, isHovered, k, h) { // 计算 let midRatio = (startRatio + endRatio) / 2; let startRadian = startRatio * Math.PI * 2; let endRadian = endRatio * Math.PI * 2; let midRadian = midRatio * Math.PI * 2; // 如果只有一个扇形,则不实现选中效果。 if (startRatio === 0 && endRatio === 1) { isSelected = false; } // 通过扇形内径/外径的值,换算出辅助参数 k(默认值 1/3) k = typeof k !== 'undefined' ? k : 1 / 3; // 计算选中效果分别在 x 轴、y 轴方向上的位移(未选中,则位移均为 0) let offsetX = isSelected ? Math.cos(midRadian) * 0.1 : 0; let offsetY = isSelected ? Math.sin(midRadian) * 0.1 : 0; // 计算高亮效果的放大比例(未高亮,则比例为 1) let hoverRate = isHovered ? 1.05 : 1; // 返回曲面参数方程 return { u: { min: -Math.PI, max: Math.PI * 3, step: Math.PI / 32 }, v: { min: 0, max: Math.PI * 2, step: Math.PI / 20 }, x: function (u, v) { if (u < startRadian) { return offsetX + Math.cos(startRadian) * (1 + Math.cos(v) * k) * hoverRate; } if (u > endRadian) { return offsetX + Math.cos(endRadian) * (1 + Math.cos(v) * k) * hoverRate; } return offsetX + Math.cos(u) * (1 + Math.cos(v) * k) * hoverRate; }, y: function (u, v) { if (u < startRadian) { return offsetY + Math.sin(startRadian) * (1 + Math.cos(v) * k) * hoverRate; } if (u > endRadian) { return offsetY + Math.sin(endRadian) * (1 + Math.cos(v) * k) * hoverRate; } return offsetY + Math.sin(u) * (1 + Math.cos(v) * k) * hoverRate; }, z: function (u, v) { if (u < -Math.PI * 0.5) { return Math.sin(u); } if (u > Math.PI * 2.5) { return Math.sin(u) * h * .1; } return Math.sin(v) > 0 ? 1 * h * .1 : -1; } }; }, // 监听鼠标事件,实现饼图选中效果(单选),近似实现高亮(放大)效果。 bindListen(myChart) { let that = this; let selectedIndex = ''; let hoveredIndex = ''; // 监听点击事件,实现选中效果(单选) myChart.on('click', function (params) { // 从 option.series 中读取重新渲染扇形所需的参数,将是否选中取反。 let isSelected = !that.option.series[params.seriesIndex].pieStatus.selected; let isHovered = that.option.series[params.seriesIndex].pieStatus.hovered; let k = that.option.series[params.seriesIndex].pieStatus.k; let startRatio = that.option.series[params.seriesIndex].pieData.startRatio; let endRatio = that.option.series[params.seriesIndex].pieData.endRatio; // 如果之前选中过其他扇形,将其取消选中(对 option 更新) if (selectedIndex !== '' && selectedIndex !== params.seriesIndex) { that.option.series[selectedIndex].parametricEquation = that.getParametricEquation(that.option.series[ selectedIndex].pieData .startRatio, that.option.series[selectedIndex].pieData.endRatio, false, false, k, that.option.series[ selectedIndex].pieData .value); that.option.series[selectedIndex].pieStatus.selected = false; } // 对当前点击的扇形,执行选中/取消选中操作(对 option 更新) that.option.series[params.seriesIndex].parametricEquation = that.getParametricEquation(startRatio, endRatio, isSelected, isHovered, k, that.option.series[params.seriesIndex].pieData.value); that.option.series[params.seriesIndex].pieStatus.selected = isSelected; // 如果本次是选中操作,记录上次选中的扇形对应的系列号 seriesIndex isSelected ? selectedIndex = params.seriesIndex : null; // 使用更新后的 option,渲染图表 myChart.setOption(that.option); }); // 监听 mouseover,近似实现高亮(放大)效果 myChart.on('mouseover', function (params) { // 准备重新渲染扇形所需的参数 let isSelected; let isHovered; let startRatio; let endRatio; let k; // 如果触发 mouseover 的扇形当前已高亮,则不做操作 if (hoveredIndex === params.seriesIndex) { return; // 否则进行高亮及必要的取消高亮操作 } else { // 如果当前有高亮的扇形,取消其高亮状态(对 option 更新) if (hoveredIndex !== '') { // 从 option.series 中读取重新渲染扇形所需的参数,将是否高亮设置为 false。 isSelected = that.option.series[hoveredIndex].pieStatus.selected; isHovered = false; startRatio = that.option.series[hoveredIndex].pieData.startRatio; endRatio = that.option.series[hoveredIndex].pieData.endRatio; k = that.option.series[hoveredIndex].pieStatus.k; // 对当前点击的扇形,执行取消高亮操作(对 option 更新) that.option.series[hoveredIndex].parametricEquation = that.getParametricEquation(startRatio, endRatio, isSelected, isHovered, k, that.option.series[hoveredIndex].pieData.value); that.option.series[hoveredIndex].pieStatus.hovered = isHovered; // 将此前记录的上次选中的扇形对应的系列号 seriesIndex 清空 hoveredIndex = ''; } // 如果触发 mouseover 的扇形不是透明圆环,将其高亮(对 option 更新) if (params.seriesName !== 'mouseoutSeries' && params.seriesName !== 'pie2d') { // 从 option.series 中读取重新渲染扇形所需的参数,将是否高亮设置为 true。 isSelected = that.option.series[params.seriesIndex].pieStatus.selected; isHovered = true; startRatio = that.option.series[params.seriesIndex].pieData.startRatio; endRatio = that.option.series[params.seriesIndex].pieData.endRatio; k = that.option.series[params.seriesIndex].pieStatus.k; // 对当前点击的扇形,执行高亮操作(对 option 更新) that.option.series[params.seriesIndex].parametricEquation = that.getParametricEquation(startRatio, endRatio, isSelected, isHovered, k, that.option.series[params.seriesIndex].pieData.value + 5); that.option.series[params.seriesIndex].pieStatus.hovered = isHovered; // 记录上次高亮的扇形对应的系列号 seriesIndex hoveredIndex = params.seriesIndex; } // 使用更新后的 option,渲染图表 myChart.setOption(that.option); } }); // 修正取消高亮失败的 bug myChart.on('globalout', function () { // 准备重新渲染扇形所需的参数 let isSelected; let isHovered; let startRatio; let endRatio; let k; if (hoveredIndex !== '') { // 从 option.series 中读取重新渲染扇形所需的参数,将是否高亮设置为 true。 isSelected = that.option.series[hoveredIndex].pieStatus.selected; isHovered = false; k = that.option.series[hoveredIndex].pieStatus.k; startRatio = that.option.series[hoveredIndex].pieData.startRatio; endRatio = that.option.series[hoveredIndex].pieData.endRatio; // 对当前点击的扇形,执行取消高亮操作(对 option 更新) that.option.series[hoveredIndex].parametricEquation = that.getParametricEquation(startRatio, endRatio, isSelected, isHovered, k, that.option.series[hoveredIndex].pieData.value); that.option.series[hoveredIndex].pieStatus.hovered = isHovered; // 将此前记录的上次选中的扇形对应的系列号 seriesIndex 清空 hoveredIndex = ''; } // 使用更新后的 option,渲染图表 myChart.setOption(that.option); }); }, //这是一个自定义计算的方法 fomatFloat(num, n) { var f = parseFloat(num); if (isNaN(f)) { return false; } f = Math.round(num * Math.pow(10, n)) / Math.pow(10, n); // n 幂 var s = f.toString(); var rs = s.indexOf('.'); //判定如果是整数,增加小数点再补0 if (rs < 0) { rs = s.length; s += '.'; } while (s.length <= rs + n) { s += '0'; } return s; }, }, // 准备待返回的配置项,把准备好的 legendData、series 传入。 } </script> <style lang="scss" scoped> //饼图(外面的容器) .container { width: 90%; height: 100%; padding-top: 15px; } //饼图的大小 .chartsGl { height: 200px; width: 380px; } //饼图底座(我也想给你们底座图片 可是我不知道咋给) .buttomCharts { background: center top url("../imgs/u111.png") no-repeat; background-size: 100% 100%; height: 95px; width: 204px; margin-top: -141px; margin-left: 21%; } .ybjgtzz { overflow-y: auto; padding: 10px; height: 250px; box-sizing: border-box; } </style> 四、常修改的参数
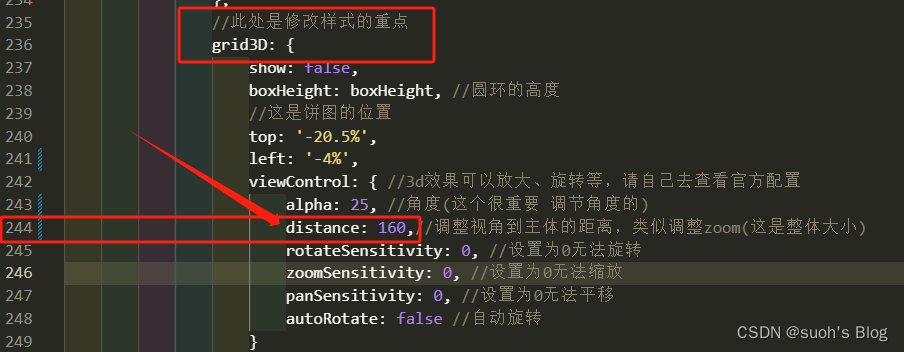
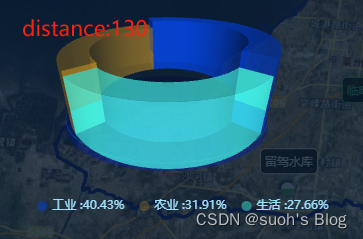
1、修改3d饼图大小,在大概244行的位置,grid3D的对象里面,修改distance属性,即可调整
值越小,图越大

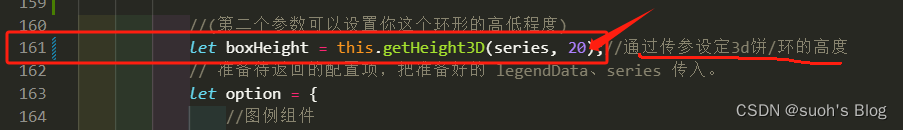
2、修改3d饼图视角高度,在大概161行的位置,修改函数的第二个参数
3、修改3d饼图颜色,直接在data中的optionData里面修改就行了
 4、修改饼图位置,这个常用,也是在grid3D这个属性里面设置,在大概240行的位置

在3d饼图中设置下面这两属性是没用的,所以这里请注意一下,记得去grid3D里面修改他的位置
最后乘上官方文档例子:echarts图表集
