
阅读量:2
vue 使用腾讯地图 标点 自定义瓦片 折线配置
申请腾讯地图秘钥 key
腾讯地图开发者 https://lbs.qq.com/dev/console/application/mine
腾讯地图开发文档 https://lbs.qq.com/webApi/javascriptGL/glGuide/glOverview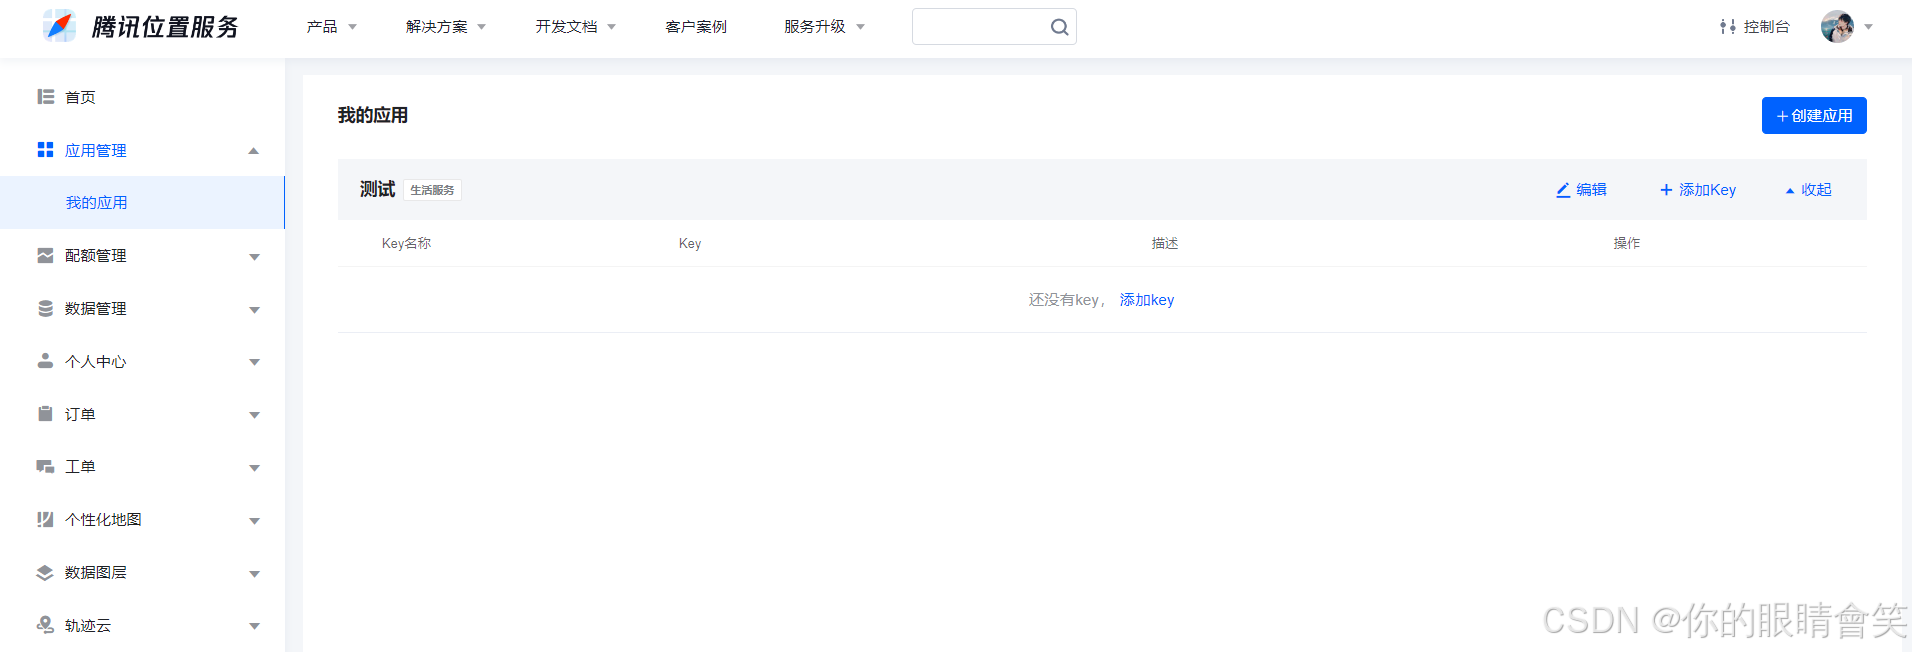
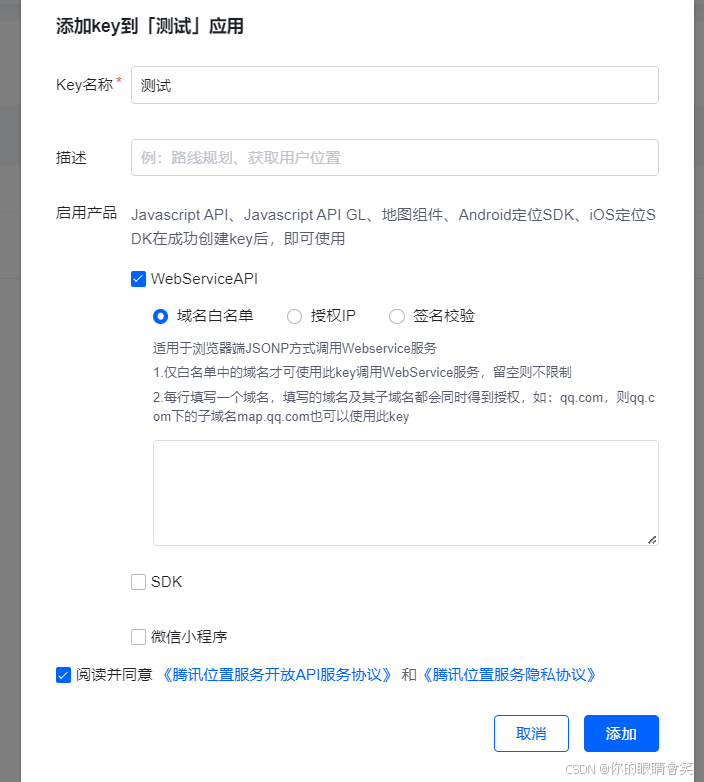
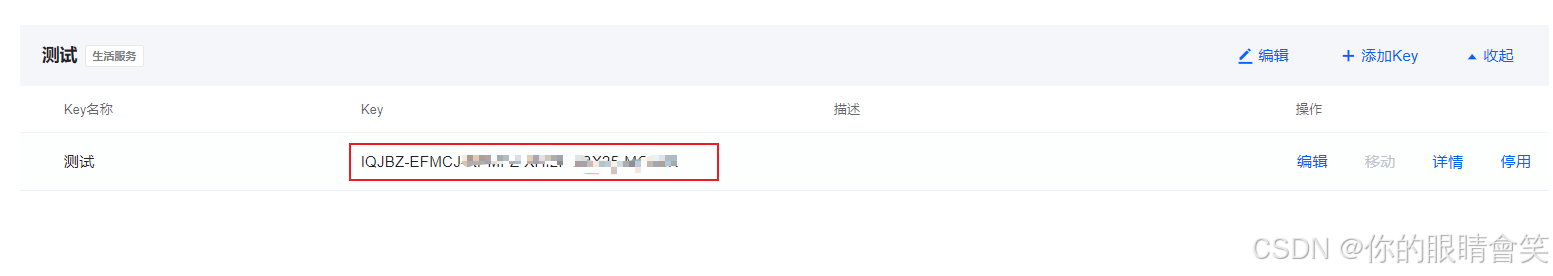
添加 key
代码中引入
// 入口文件 index.html // 填入你申请的key <script charset="utf-8" src="https://map.qq.com/api/gljs?v=1.exp&key=这里是你申请的key"></script> <script src="https://res.wx.qq.com/open/js/jweixin-1.6.0.js"></script> - 初始化
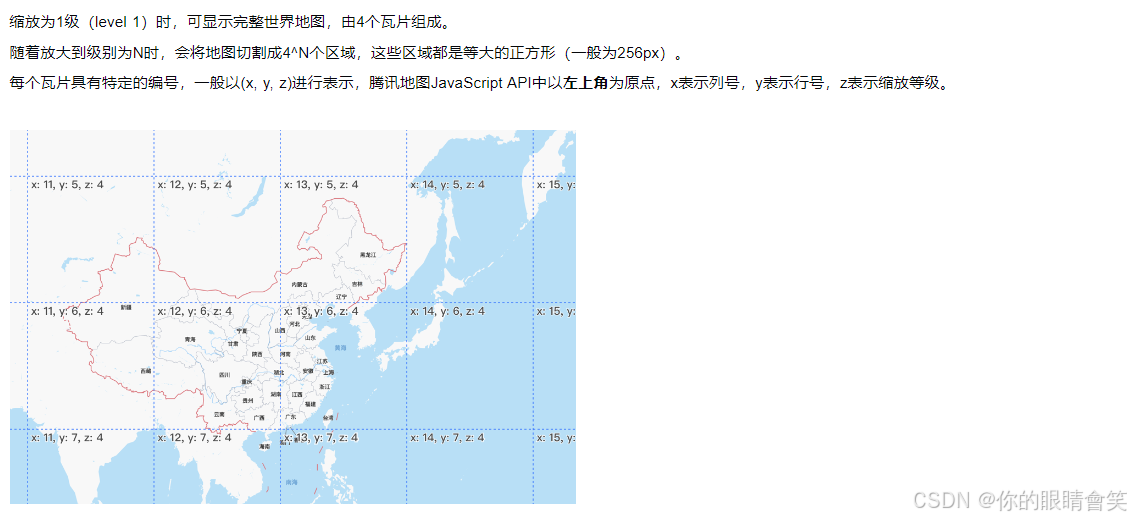
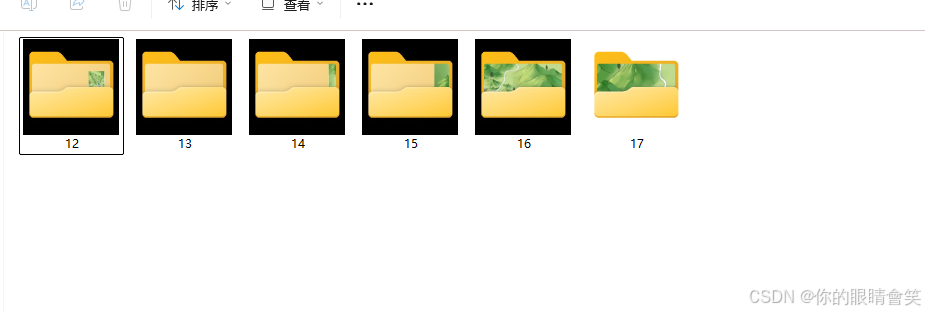
// 这是切好的瓦片图 文件夹名字为 z 文件名字为 x_y
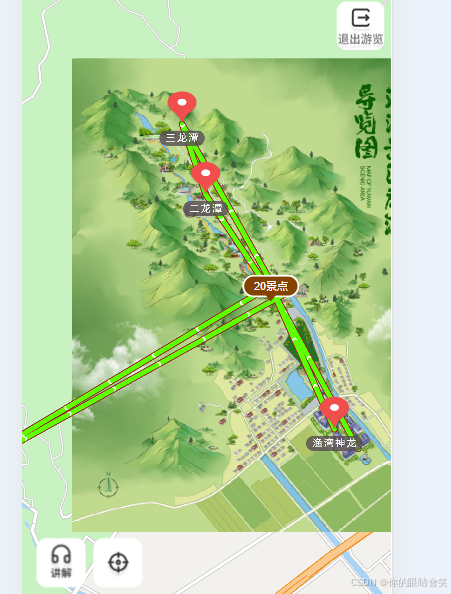
<template> <div id="mapContainer"></div> </template> data(){ return { mapObj:null, mapMarker:null } }, mounted(){ this.$nextTick(()=>{ initMap() }) }, methods:{ initMap() { var center = new TMap.LatLng(26.870355, 110.239704) //设置中心点坐标 // 初始化地图 this.mapObj = new TMap.Map("mapContainer", { center: center, zoom: 12, // 地图默认缩放级别 showControl: true, // 是否显示地图上的控件 // viewMode: '2D', // 地图视图模式,支持2D和3D,默认为3D。2D模式下俯仰角和旋转角度始终为0 rotation: 0, //设置地图旋转角度 }); // 初始化瓦片 // 瓦片图需要切好每个位置的图 // x,y,z 为上图的坐标 new TMap.ImageTileLayer({ getTileUrl: function (x, y, z) { console.log(x,y,z) //拼接瓦片URL let url = `https://xxxxxxxxx.com/${cutUrl}/` + z + "/" + x + "_" + y + ".png"; return url; }, tileSize: 256, //瓦片像素尺寸 minZoom: Number(baseData.mapMinRatio), //显示自定义瓦片的最小级别 maxZoom: Number(baseData.mapMaxRatio), //显示自定义瓦片的最大级别 visible: true, //是否可见 zIndex: 5000, //层级高度(z轴) opacity: 1, //图层透明度:1不透明,0为全透明 map: this.mapObj, //设置图层显示到哪个地图实例中 }); //当图中打点非常密集,地图的可读性变差时,推荐使用点聚合功能,它会根据您的设置,自动将距离相近的标记聚合到一起,以统计数字方式呈现在图中相应位置,从而实现清晰、易读的场景需求。 this.markerCluster = new TMap.MarkerCluster({ id: "cluster", map: this.mapObj, enableDefaultStyle: false, // 关闭默认样式 minimumClusterSize: 2, geometries: [ // 这个数据可以写死 也可以调用方法 动态添加 {position: new TMap.LatLng(39.982829,116.306934)}, {position: new TMap.LatLng(39.989011,116.323586)}, {position: new TMap.LatLng(39.978751,116.313286)}, {position: new TMap.LatLng(39.980593,116.304359)}, ], zoomOnClick: true, gridSize: 60, averageCenter: true, }); // 或者使用该方法 添加数据 // this.markerCluster.setGeometries([]); // 折现初始化 // 此处变量为动态配置的颜色 你也可以写死 let lineColor = this.baseData.lineColor; let lineThickness = this.baseData.lineThickness; let lineOuterColor = this.baseData.lineOuterColor; let lineOuterThickness = this.baseData.lineOuterThickness; this.polyline = new TMap.MultiPolyline({ id: "polyline-layer", map: this.mapObj, styles: { polyline: new TMap.PolylineStyle({ color: lineColor, //线填充色 width: lineThickness, //折线宽度 borderWidth: lineOuterThickness, //边线宽度 borderColor: lineOuterColor, //边线颜色 lineCap: "round", //线端头方式 showArrow: true, ArrowOptions: { space: 5, }, }), }, geometries: [ // 这个数据可以写死 也可以调用方法 动态添加 // 此处为点数据 同上面一样 ], }); // 或者使用该方法 添加数据 // this.polyline.setGeometries([]); // 标记点文本 this.labelMarker = new TMap.MultiLabel({ id: "label-layer", map: this.mapObj, zIndex: 7000, styles: { label: new TMap.LabelStyle({ alignment: "center", //文字水平对齐属性 verticalAlignment: "middle", //文字垂直对齐属性 color: "#fff", size: 18, offset: { x: 0, y: 20 }, backgroundColor: "rgba(86, 76, 84, 0.80)", // strokeWidth: 2, borderRadius: 25, padding: "4px 20px", }), labelN: new TMap.LabelStyle({ alignment: "center", //文字水平对齐属性 verticalAlignment: "middle", //文字垂直对齐属性 color: "#fff", size: 12, offset: { x: 0, y: 15 }, backgroundColor: "rgba(86, 76, 84, 0.80)", // strokeWidth: 2, // width :140, // height: 20, padding: "2px 12px", borderRadius: 25, }), labelEn: new TMap.LabelStyle({ alignment: "center", //文字水平对齐属性 verticalAlignment: "middle", //文字垂直对齐属性 color: "#333", size: 12, offset: { x: 0, y: 15 }, backgroundColor: "rgba(254,250,245,0.85)", // strokeWidth: 2, width: 180, height: 20, borderRadius: 25, }), }, enableCollision: false, geometries: [ // 这个数据可以写死 也可以调用方法 动态添加 // 此处为点数据 同上面一样 ], }); // 标记点 标记点点击事件 this.mapMarker = new TMap.MultiMarker({ map: this.mapObj, // 显示Marker图层的底图 zIndex: 6000, styles: { small_1: new TMap.MarkerStyle({ // 点标注的相关样式 width: 32, // 宽度 height: 36, // 高度 anchor: { x: 16, y: 36 }, // 标注点图片的锚点位置 src: "./images/smartMap/spot.png", // 标注点图片url或base64地址 }), big_1: new TMap.MarkerStyle({ width: 40, height: 48, anchor: { x: 20, y: 48 }, src: "./images/smartMap/spot.png", }), user: new TMap.MarkerStyle({ width: 36, height: 44, anchor: { x: 18, y: 44 }, src: "https://eshopfile.xxxxx.com/2023031609350436976.png", }), }, enableCollision: false, // 开启碰撞 geometries: [ // 这个数据可以写死 也可以调用方法 动态添加 // 此处为点数据 同上面一样 ], }); // 标记点点击事件 this.mapMarker.on("click", this.markerClick); // 点击事件 this.mapObj.on("click", this.mapClick); }, mapClick(val) { // 点击事件返回经纬度 等各种信息 console.log(val) }, markerClick(res){ console.log(res) } } 效果图
项目中的图片 请更换为您自己的图片。
该博客 包含 地图的初始化 折线 瓦片图 标记点 标记点文本 等实现信息。 希望可以帮助您!
